
-1.png)

Table of Contents
Like this article?
Subscribe to our Linkedin Newsletter to receive more educational content
Subscribe nowSLO, SLA, and SLI best practices
Now that we’ve covered the fundamental differences between SLO vs SLA vs SLI, the sections below will explain how teams can effectively implement the concepts. Teams that use the best practices below can drive both operational excellence and stakeholder clarity.
Start with metrics
Most teams already know how to collect service data. Their dashboards track request counts, latency, error rates, and uptime checks, while logs, traces, and business events provide context. This data shows how the system behaves and helps the team locate failures. It does not automatically identify the user outcome that should define reliability.
For a checkout service, HTTP status and request latency can both look healthy while customers cannot complete purchases. The API may return HTTP 200 with low latency even though payment processing failed or no confirmation event followed. The dashboard accurately reports that the API responded, but the customer still has no completed order. HTTP status and latency remain useful for diagnosis, but neither represents checkout completion on its own. The team still has to choose the measurement that does.
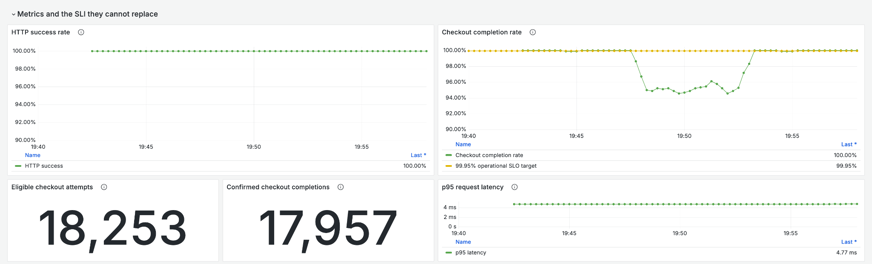
HTTP success and request latency hold steady while checkout completion falls to 94.6% over the same period.
Choose SLIs that represent user success
Once a team has its SRE metrics, it must decide which measurement represents user success. That decision starts with the user journey, not the dashboard. The team needs to name the action that matters, the event that marks success, the attempts that belong in the measurement, and the time allowed for success to occur. These boundaries make the outcome measurable and prevent unrelated events from changing the result.
|
Selection check |
Question to answer |
Checkout example |
|
User journey |
Which user action matters enough to measure? |
Completing a purchase |
|
Success event |
Which observable event marks a successful outcome? |
Any attempt that reaches a definite outcome that holds, such as a confirmed order or a valid decline |
|
Eligible population |
Which attempts belong in the measurement? |
Submitted checkout attempts that pass initial validation |
|
Failure treatment |
Which outcomes represent service failure, and which are valid exclusions? |
A processor timeout counts as failure. A valid issuer decline does not. |
|
Completion boundary |
When must the success event occur? |
Within the defined checkout completion interval |
|
Data availability |
Do existing metrics expose both the successful event and the eligible population? |
The service needs separate counters for eligible checkout attempts and for the outcomes they reach. |
Data availability comes after teams define the measurement. A team that only records HTTP responses should not choose HTTP success as its SLI simply because the metric already exists. If the service does not record both the success event and the eligible population, it needs additional instrumentation first.
For checkout, the SLI counts successful outcomes against eligible checkout attempts. The processor timeout counts as a failure because the attempt ended without an outcome, whereas the issuer decline does not, since the checkout service returned the expected result.
checkout completion rate = successful checkout outcomes / eligible checkout attempts
If those counters do not exist yet, instrumenting checkout means recording one event when an eligible checkout begins and another when the order or payment is confirmed. The availability monitoring guide covers that work in more detail. Once the measurement is defined and the data is available, the team can examine its historical performance and decide what SLO target the service should meet.

Customer-Facing Reliability Powered by Service-Level Objectives
Service Availability Powered by Service-Level Objectives
Learn More
Integrate with your existing monitoring tools to create simple and composite SLOs

Rely on patented algorithms to calculate accurate and trustworthy SLOs

Fast forward historical data to define accurate SLOs and SLIs in minutes
Set SLOs as internal reliability targets
An SLO target is the team's internal reliability commitment for the measured user outcome. It gives product and engineering a shared standard for deciding when normal product work can continue and when reliability needs attention. Unlike an SLA, the commitment is operational, not contractual.
For checkout, this article uses an illustrative SLO target of 99.95% completion. The percentage is only part of the SLO: the evaluation window defines how much history belongs in each result, and the SLI measurement defines which events count.
Use evidence to set the SLO target
The table below summarizes common evidence used to set SLO targets.
|
Evidence |
What to check |
Checkout application |
|
User and business need |
Determine how failure affects the user journey and its measurable business result. |
Failed checkouts prevent purchases and affect revenue. |
|
Historical performance |
Review what the SLI delivered over a representative period, as evidence rather than as an automatic answer. |
Review the previous 30 days of checkout completion data. |
|
Incident evidence |
Test whether the target flags incidents that caused real user harm without treating normal operation as failure. |
Compare it with periods containing payment failures, lost orders, or support spikes. |
|
Dependencies and architecture |
Examine how dependencies affect the user outcome and which controls reduce that effect. |
Review payment processor behavior, retries, alternate providers, fallbacks, and asynchronous confirmation. |
|
Evaluation window |
Choose a period with enough events to represent normal behavior and short enough to respond when conditions change. |
Use a rolling 30-day window. |
|
Cost and risk |
Identify the engineering changes the target requires and the business risk of not making them. |
Decide whether checkout needs additional recovery controls to support 99.95%. |
Once the SLI is defined, Nobl9 SLI Analyzer can import its historical data and show how the service would have performed under the proposed target and budgeting settings. How far back it reaches depends on a retrieval limit Nobl9 sets per data source, with 30 days the ceiling for most. The team still decides whether the target reflects user need, business impact, and acceptable risk.
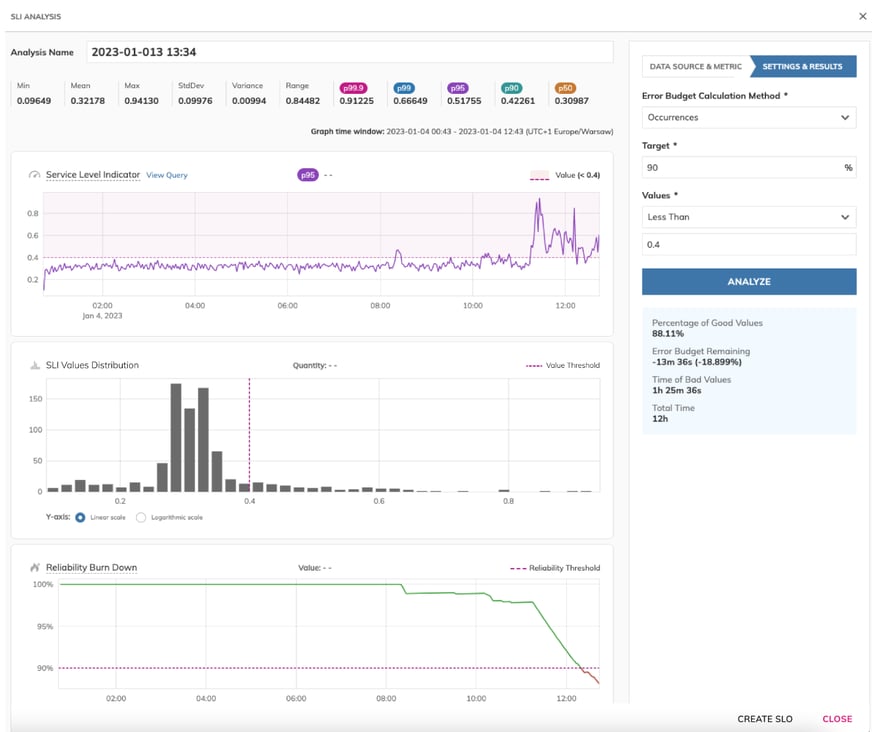
Nobl9 SLI Analyzer testing a proposed target against imported historical data
Customer-Facing Reliability Powered by Service-Level Objectives
Service Availability Powered by Service-Level Objectives
Learn More
Document SLOs clearly
A target is challenging to manage when nobody can explain why it exists, who owns it, or when it should be reviewed. The SLODLC framework provides worksheets for recording those decisions. A simplified record covers what a team needs to begin.
|
|
The full SLODLC templates add more detail as the practice grows. Teams can also store the definition as SLO as code, keeping the SLI queries, SLO target, and evaluation window in version control alongside system configuration.
Use error budgets to guide engineering decisions
The error budget converts the difference between the SLO target and perfect reliability into an amount of failure the service can tolerate before missing the SLO.
Calculate the error budget
The calculation is the difference between perfect reliability and the SLO target:
error budget = 100% - SLO target
The checkout SLO target is 99.95% over a rolling 30-day window:
100% - 99.95% = 0.05%
Because the checkout SLI counts attempts, the budget applies to eligible checkout attempts. If the service handles one million eligible attempts during the window, it can tolerate 500 failed attempts before missing the SLO:
1,000,000 eligible attempts x 0.05% = 500 failed attempts
Budget consumed and budget remaining show how much of that allowance the service has used and how much is left. Neither explains how urgently the team needs to respond. That requires burn rate.
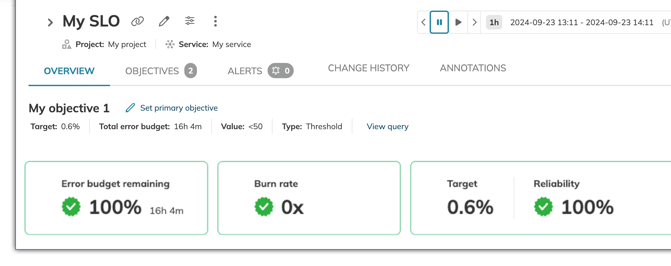
Nobl9 reports error budget remaining and burn rate together for a single objective
Use burn rate to judge urgency
Burn rate compares the observed failure rate with the failure rate permitted by the SLO:
burn rate = observed failure rate / permitted failure rate
The checkout SLO permits a 0.05% failure rate. If the observed failure rate rises to 0.5%, the service is consuming its error budget ten times faster than the SLO permits. If the full budget is available and that rate continues:
time to consume one full budget = SLO window / burn rate
30 days / 10 = 3 days
Burn rate alone does not determine whether an event is an incident. The team also needs to know how long the rate continued and how much budget it consumed:
budget consumed = burn rate x observation period / SLO window
A 10x burn rate lasting one hour consumes approximately 1.39% of a 30-day budget. The team's response depends on user impact, budget already consumed, and the error-budget policy. A short spike and a sustained burn at the same rate carry different risks.
Alerting on burn rate involves a tradeoff between windows. A short lookback window detects sudden failures quickly but reacts to brief spikes, while a long window confirms sustained failure but responds slowly. Nobl9 calculates the remaining budget and burn rate from the configured SLO, and its alert policies support fast-burn, slow-burn, and multi-window configurations that require both conditions to be met before alerting. The team still chooses the windows, thresholds, and response.
Write the error-budget policy
Burn-rate alerts show when reliability is at risk. The error-budget policy specifies the team's response, so engineers do not renegotiate the budget's meaning during every release or incident.
The following traffic-light model is an illustrative starting point:
|
Budget state |
Example condition |
Team response |
|
Green |
More than 50% budget remaining |
Continue normal releases and monitor burn rate |
|
Yellow |
25-50% budget remaining or burn rate rising |
Review risky changes and investigate recurring failures |
|
Red |
Less than 25% budget remaining or fast burn during an incident |
Pause non-critical releases and prioritize reliability work |
Each team should select conditions that match its service and record the release, investigation, and escalation actions attached to each state.
Create SLAs based on reliability you can defend
At this point, the business has SLI data, SLO history, incident records, and error-budget behavior. An SLA turns that evidence into a service commitment the business is prepared to stand behind, backed by a measurement method and stated consequences if it misses the commitment.
The checkout SLO target already sits at 99.95% completion over a rolling 30-day window, which updates continuously and gives the team early warning as conditions change. An SLA reports against a fixed calendar period instead, and a rolling result cannot tell you what a calendar month delivered, so the team recomputes checkout completion month by month. If the team’s analysis puts the weakest calendar month at 99.93%, a 99.9% commitment survives it. The same month missed the 99.95% SLO target without breaching the promise.
The gap between the 99.95% SLO target and the 99.9% service commitment is not just about detection speed. It has to cover the variability the SLI measurement has already shown, the risk from dependencies and past incidents, uncertainty in the measurement itself, and how fast the team can respond once burn rate signals a problem. A team that detects and recovers quickly can defend a narrower margin than one that discovers failures late.
Defending that number also means defining it precisely enough to be enforceable.
|
SLA detail |
What it defines |
Checkout example |
|
Covered service or experience |
The product, service tier, region, API, workflow, or customer experience the promise applies to |
The customer-facing checkout flow |
|
Service level |
The measurable commitment, such as monthly availability, request success, latency, durability, or another agreed service metric |
99.9% checkout completion for each calendar month |
|
Measurement source |
The data used to calculate the service level, such as SLI/SLO data, logs, uptime checks, or provider reports |
Successful checkouts outcomes and eligible checkout attempts from the checkout SLI measurement, recomputed over the calendar month |
|
Reporting period |
The period used to evaluate the promise, often a calendar month for customer-facing agreements |
Calendar month, UTC |
|
Exclusions |
Conditions that do not count against the commitment, such as scheduled maintenance or customer-side failures |
Scheduled maintenance windows removed when the monthly figure is recomputed |
|
Remedy |
What happens when the promise is missed, such as service credits, escalation, termination rights, or another agreed consequence |
Service credits proportional to the shortfall, as defined in the contract |
|
Verification |
How customers or internal teams confirm the number, such as reports, dashboards, portals, or support requests |
The customer may request the checkout completion rate for a prior calendar month by filing a support ticket. |
Nobl9 calendar-aligned SLOs can match this reporting period directly, and the SLO History report surfaces risk before the period closes. The report communicates evidence. It does not replace the authoritative data source, formula, exclusions, and dispute procedure the agreement defines.
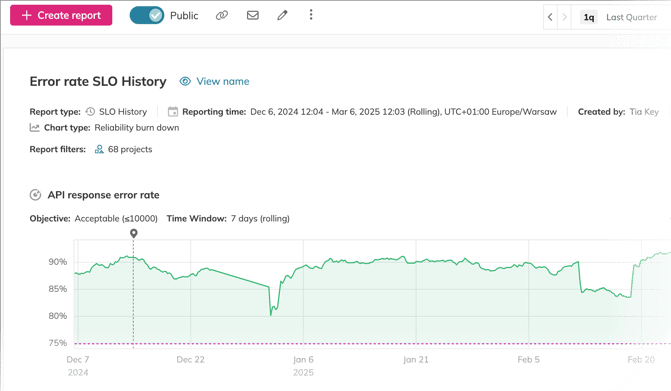
A Nobl9 SLO history report covering a defined reporting period, which the team can share with stakeholders
Navigate Chapters: