
Table of Contents

A Service Level Objective (SLO) is a service reliability target expressed as a percentage over time, such as 99.9% of requests succeeding over 30 days. The error budget is the remaining 0.1% an SLO is allowed to fail before it's considered breached.

Datadog keeps that budget beside the metrics, traces, and dashboards teams already use, so an engineer can move from a burning budget to the trace that explains it without switching tools. This article explores these features in detail.

Operations teams usually face a couple of challenges when scaling their SLO programs. First, Datadog SLOs only measure the data collected directly by Datadog. For example, signals from Splunk, Prometheus, or a data warehouse must be forwarded to DataDog as a billable custom metric, which becomes expensive at scale. Second, the rolling window cap is 90 days, which limits how far back a live SLO can look. Third, they lack the advanced features that specialized SLO platforms provide.

The presence of these constraints doesn’t suggest that users must stop using DataDog SLOs. A better approach is to use them for what they do well and complement them with a specialized tool that can collect data from any monitoring tool and offer advanced SLO functionality.

This article explains Datadog's native SLO features in depth and walks through additional use cases enabled by Nobl9, a specialized SLO platform that augments third-party monitoring tools and enables entirely new ways to manage SLOs.

NEW: Watch how you can use AI to Discover which SLIs to measure

Watch 3-min Video. No forms.

Summary of Datadog SLO features and the augmented functionality via a specialized tool

The table below summarizes six Datadog SLO concepts this article will explore in more detail.

Concept

Description

Datadog SLO types and error budgets

Metric-based, monitor-based, and time-slice SLOs each track a different signal shape, and burn-rate alerts pair a long detection window with a short one.

SLO-as-code and single-pane investigation

The datadog_service_level_objective Terraform resource puts an SLO under version control, and a breach is one click from the trace or log that caused it.

Where native Datadog SLOs hit scale limits

Datadog SLOs measure only data Datadog holds, so external signals need forwarding first, often as billable custom metrics, and rolling windows stop at 90 days.

Composite SLOs across a mixed data estate

Nobl9 reads SLIs from sources like Splunk, Prometheus, and CloudWatch in their native query language, then rolls a multi-tool user journey into one weighted budget.

Setting and testing SLO targets before launch

The SLI Analyzer imports 30 days of history to propose an achievable target, and alert-policy testing replays a past interval before a threshold ever pages anyone.

Governing SLOs across teams and agents

Projects, RBAC, and labels let each team own its SLOs without touching another's, and the Nobl9 MCP server exposes the same operations to coding agents.

Datadog SLO types and error budgets

Datadog supports three SLO types, each designed for a different signal shape.

  1. Metric-based SLOs use a ratio of good events to total events, such as successful requests divided by all requests.
  2. Monitor-based SLOs measure the uptime of an existing monitor, so they track the same data the monitor watches.
  3. Time-slice SLOs score each short window as good or bad and define good minutes directly, so they require no separate monitor, reducing setup for new SLOs.

Error budget alerting combines a longer window (hours) with a shorter one (minutes), and budget alerts trigger when spending reaches a threshold, such as 75% of a 7-day budget. Note that burn-rate alerts for monitor-based SLOs evaluate only the overall SLO. Metric-based and time-slice SLOs instead support group-level burn alerts, so individual regions or endpoints can trigger their own alerts.

Choose the SLO type up front, as it determines the available alert granularity.

For example, a metric-based SLO could track successful checkout API calls over total checkout API calls, scoped to one service tag, with a 99.9% target over a 30-day rolling window. Datadog computes that ratio continuously. The error budget appears as a running tally of allowed failures, letting engineers see remaining allowed failures rather than just percentages.

SLO-as-code and single-pane investigation

Datadog exposes the datadog_service_level_objective Terraform resource, which places SLOs in pull requests alongside other infrastructure changes. Teams review SLO changes alongside firewall rules and autoscaling policies, using existing CI pipelines. A minimal version of that resource looks like this:

resource "datadog_service_level_objective" "checkout_availability" {
name = "Checkout API availability"
type = "metric"
description = "99.9 percent of checkout API requests succeed"

query {
numerator = join(" - ", [
"sum:trace.http.request.hits{env:prod,service:checkout-api}.as_count()",
"sum:trace.http.request.errors{env:prod,service:checkout-api}.as_count()",
])
denominator = "sum:trace.http.request.hits{env:prod,service:checkout-api}.as_count()"
}

thresholds {
timeframe = "30d"
target = 99.9
warning = 99.95
}

# Primary window shown in list views and used by burn rate alerts
timeframe = "30d"
target_threshold = 99.9
warning_threshold = 99.95

tags = ["service:checkout-api", "env:prod", "team:payments"]
}

The resource block reads like any other piece of Terraform-managed infrastructure, which is what makes it easy to fold into an existing review process instead of building a separate one just for reliability targets.

Staying within Datadog pays off during incidents. When metrics, logs, APM traces, monitors, and incident management all live in one tool, an SLO breach is one click from the trace or log line that caused it, with no context switch and no second vendor in the loop. For teams fully invested in Datadog, this unified workflow is efficient, and warrants consideration when building a reliability program.

Where native Datadog SLOs hit scale limits

SLOs only measure signals the platform can access. Datadog SLOs use only data collected by Datadog, so a log-based SLI from Splunk, for example, must be forwarded to Datadog first. This typically requires forwarding the signal as a custom metric. A Prometheus histogram or a BigQuery batch job has the same requirement because data must be transferred before an SLO can be supported.

The 90-day cap on rolling windows is a second constraint, though it's narrower than it appears. That cap applies only to the live rolling evaluation window. Datadog's calendar view shows up to 12 months of historical SLO status for metric-based and time-slice SLOs, covering most quarterly and annual reporting needs. Monitor-based SLOs don't have that calendar view, so reports spanning them require assembly outside the SLO view. Neither limit is a defect. Both happen when an SLO program outgrows a single team operating within one tool, when spanning additional data sources, teams, or acquisitions with existing stacks.

A concrete version of the forwarding problem: a Prometheus histogram tracking p99 latency for a service that never sent data to Datadog needs a metrics pipeline built specifically to relay it in. This metric then competes for the same custom metric quota as other forwarded data.

A concrete version of the reporting problem: a team relying on a monitor-based SLO that doesn't provide a 12-month calendar view still needs to stitch together monthly Datadog API exports for annual SLA reporting.

Addressing these limits doesn't require leaving Datadog. Instead, add a layer above for signals, targets, and governance beyond a single tool's SLO coverage. The four cases below integrate Nobl9, a dedicated SLO platform, with existing Datadog instrumentation.

Customer-Facing Reliability Powered by Service-Level Objectives

Service Availability Powered by Service-Level Objectives

Learn More

Integrate with your existing monitoring tools to create simple and composite SLOs

Rely on patented algorithms to calculate accurate and trustworthy SLOs

Fast forward historical data to define accurate SLOs and SLIs in minutes

Composite SLOs across mixed data

Checkout flows often span several monitoring tools. Consider a flow that calls an API instrumented with Datadog, reads from a database monitored by Amazon CloudWatch, and processes through a Prometheus-monitored queue. Nobl9 reads each signal in its source's native query language, so a Prometheus histogram stays a PromQL query and a CloudWatch metric stays a CloudWatch query, without forwarding or duplication.

Nobl9 first defines three component SLOs, one per source, then rolls them into one composite SLO, a weighted error budget reported as a single value rather than three disconnected numbers. Each component carries a weight, and the composite's Max delay setting controls how long Nobl9 waits for that component's data before treating it as late, while When delayed decides how the late data counts toward the budget. Service owners get one budget to track instead of reconciling three dashboards manually. Datadog retains the API signal as before. Nobl9 integrates this signal alongside CloudWatch and Prometheus data.

A representative weighting might give the Datadog-sourced API objective 50% of the composite budget, the CloudWatch database objective 30%, and the Prometheus queue objective the remaining 20%, reflecting how much each component drives the user-facing checkout experience. If the queue backs up during a batch job while the API and database both stay healthy, the composite budget still reflects that partial degradation instead of hiding it inside three separate all-green dashboards.

Key insight: A composite SLO adds value when signals span multiple tools. When a user journey spans databases or queues outside Datadog, a rolled-up budget replaces the need for manual dashboard reconciliation.

Setting and testing SLO targets before launch

Choosing realistic targets stalls most new SLOs. Teams either guess at a number or spend days querying months of history. Targets set by guesswork tend to be revised once real traffic arrives.

Nobl9's SLI Analyzer imports up to 30 days of historical data for a candidate SLI, including one sourced straight from Datadog, and computes a statistical profile: value distribution over time and reliability burn-down against proposed targets. Teams can validate whether 99.9% is achievable based on prior service behavior before deployment, rather than relying on inherited, unvalidated targets.

Nobl9 can propose the target for you. Its AI SLO discovery analyzes existing telemetry and drafts SLIs, targets, and error budgets with supporting rationale. Nobl9 Assist drafts the manifest in-app and applies it upon approval. Review proposals against historical data in the SLI Analyzer.

Teams assuming 99.9% for unmetered services often find the analyzer suggesting 99.7%, accounting for monthly maintenance windows and regional latency spikes in the data. That gap matters. Setting 99.9% when service history shows 99.75% max ensures the error budget begins to be depleted.

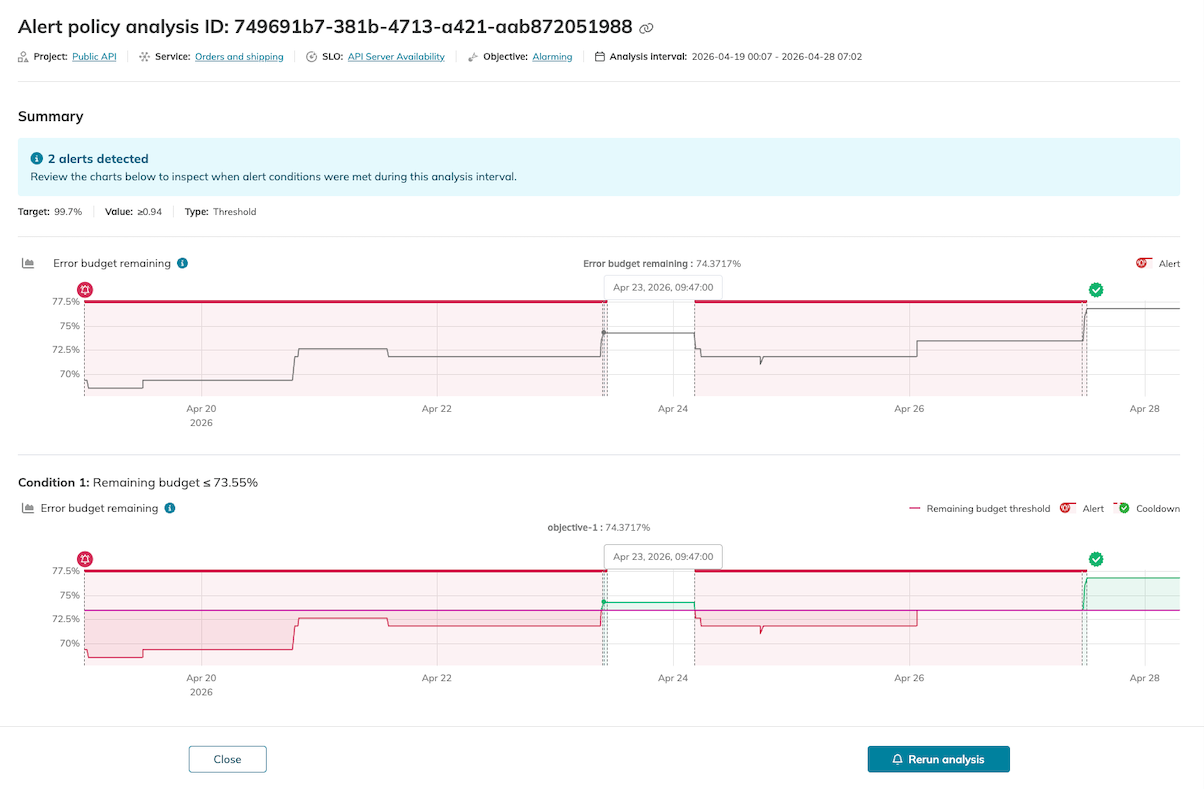
Similar testing applies to alerting. Nobl9's alert-policy testing replays a historical interval and auto-fills alert conditions based on observed budget drops, letting teams simulate burn-rate policies against real incidents before paging anyone. The output shows detected alerts, the error budget remaining over that window, and per-condition detail, which turns alert design from a guess at thresholds into a check against behavior the system has already shown.
alert-policy-analysis

Nobl9 alert-policy simulation showing detected alerts against the error budget remaining chart for a replayed incident

Key insight: Teams with established thresholds gain less from testing. For new SLOs on unmeasured services, validation against history cuts weeks of guesswork to hours.

Customer-Facing Reliability Powered by Service-Level Objectives

Service Availability Powered by Service-Level Objectives

Learn More
Governing SLOs across teams and agents

Version control alone doesn't solve governance when dozens of teams share thousands of SLOs. Nobl9 packs SLOs, data sources, budgeting methods, and alert policies into YAML objects aligned with the SLO lifecycle.

apiVersion: n9/v1alpha
kind: SLO
metadata:
name: checkout-api-latency
displayName: Checkout API latency
project: payments
labels:
team:
- payments
tier:
- critical
spec:
description: p99 checkout API latency under 300ms
service: checkout-api
indicator:
metricSource:
name: prometheus
project: payments
kind: Agent
budgetingMethod: Occurrences
objectives:
- displayName: p99 under 300ms
name: p99-under-300ms
value: 0.3
op: lte
target: 0.999
primary: true
rawMetric:
query:
prometheus:
promql: >-
histogram_quantile(0.99, sum by (le) (
rate(http_request_duration_seconds_bucket{service="checkout-api"}[5m])
))
timeWindows:
- unit: Day
count: 30
isRolling: true
alertPolicies:
- fast-burn-5x

sloctl applies and verifies the objective in the same way kubectl applies a manifest.

sloctl apply -f checkout-api-latency.yaml
sloctl get slo checkout-api-latency -p payments

Agent integration extends this capability. The Nobl9 MCP (Model Context Protocol) server exposes list, define, and update operations to coding agents, including Claude, Cursor, and Gemini CLI, so teams can manage an SLO in natural language.

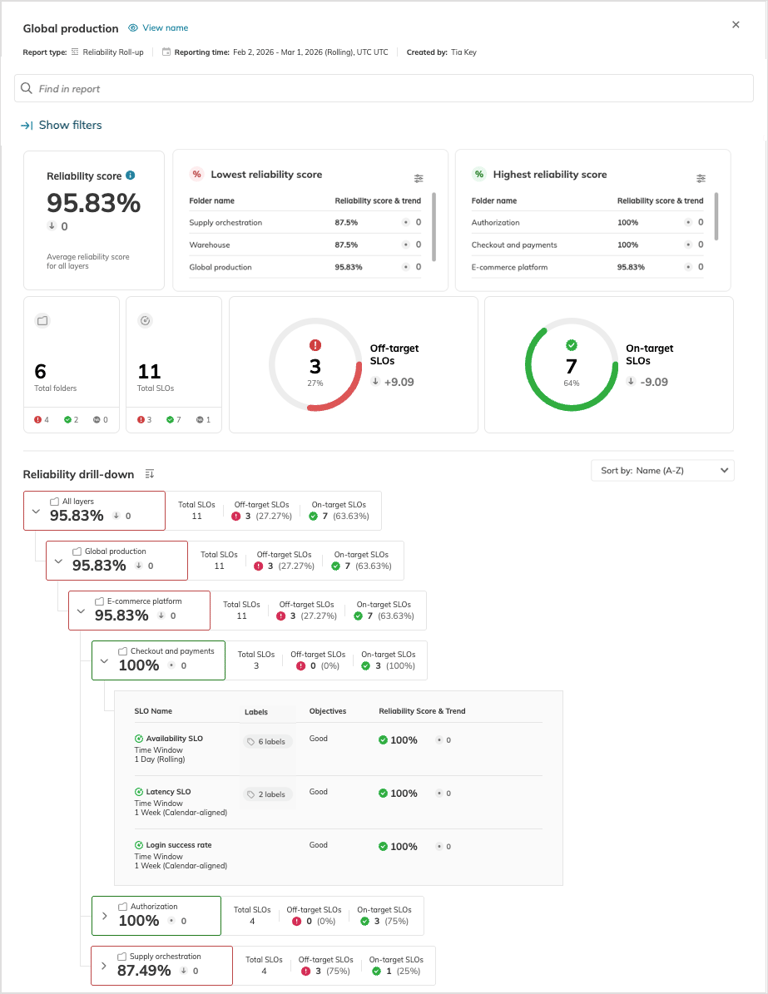
Governance scales through organizational structure rather than per-object configuration. Nobl9 projects group services, SLOs, data sources, and alert methods, and role-based access control assigns organization and project roles so each team owns its SLOs without touching another team's. Labels organize SLOs across projects. Alert methods are centralized rather than embedded into each objective. The Reliability Roll-up report provides leads with a single view of SLO health across the entire environment, including Datadog-sourced SLOs.

For instance, that might mean a payments team holding write access to its own project while a platform reliability lead holds read access across every project labeled tier:critical, without either team needing a shared Datadog account role rewritten to grant it. The MCP server extends the same boundary to agents: a payments engineer's Claude session can list and update SLOs inside the payments project without ever seeing what a separate team's project contains.

Key insight: If a reliability program lives entirely inside Datadog account roles, this scaling problem may not have hit yet. Once dozens of teams share thousands of objectives, projects, labels, and RBAC turn a flat list into a portfolio someone can actually own.
global-production

Nobl9 Reliability Roll-up report showing SLO health rolled up across multiple projects and teams, including objectives sourced from Datadog

Visit SLOcademy, our free SLO learning center

Visit SLOcademy. No Form.

Conclusion

The right SLO governance choice depends on organizational context. Consider who owns the reliability target portfolio and where each SLO runs. Small teams fully invested in Datadog benefit from the simplicity and low overhead of native SLO management. As teams scale, dedicated platforms like Nobl9 are more valuable.

A small team running one fully Datadog-instrumented service faces no composite SLO or cross-team RBAC challenges. Adding Nobl9 prematurely means paying for unnecessary governance. But when multiple teams span projects, programs, and business units, robust SLO governance is necessary.

The choice comes down to whether SLO governance should live in a single tool or in a layered platform that spans multiple tools.

Learn how 300 surveyed enterprises use SLOs

Download Report

Navigate Chapters:

Continue reading this series