

Table of Contents

While the acronym 'MTTR' is static, the final letter stands for four different measurements: Mean Time to Repair, Recovery, Respond, or Resolve. Each variant uses a different timeline, yet teams often treat them as interchangeable metrics. Unfortunately, none of these variants inherently focus on the end-user experience. As a result, an 'MTTR' metric can look excellent on a dashboard while users endure degraded service. For example, a 5-minute restart of a stalled message broker that doesn’t affect services counts as one incident, just as a 5-minute major outage affecting all application end-users does.

This article covers what MTTR actually measures, how to calculate it without quietly changing the boundaries, and where it fits among the other incident metrics operations teams usually track. We then examine why the law of averages can be misleading and how service-level objectives (SLOs) use error-budget burn and time-to-budget recovery to measure user experience. The goal is not to discard MTTR but to use it for what it is good at and stop thinking of it as a service quality metric.

NEW: Watch how you can use AI to Discover which SLIs to measure

Watch 3-min Video. No forms.

Summary of key mean time to repair concepts

The table summarizes six essential mean time to repair concepts that this article will explore in more detail.

Concept

Description

The four meanings of MTTR

Repair, recovery, respond, and resolve track different clocks that start and stop at different events. Mixing them into a single dataset produces numbers that cannot be compared across teams or tools. Name the variant before tracking it.

The MTTR formula and its boundaries

Divide the total repair time by the number of repairs. What you include (detection, diagnosis, fix, verification) and exclude (parts or approval waits) impacts whether the number means anything. Two teams using the same formula can report values that differ by hours.

MTTR in the incident timeline

Detection, acknowledgment, recovery, and failure-interval metrics (MTTD, MTTA, MTTR, MTBF) measure adjacent segments of one timeline, from failure through detection, acknowledgment, and recovery. Availability ties the two together as MTBF/(MTBF + MTTR).

Factors that inflate MTTR

Service dependencies, alert noise, manual diagnosis, stale runbooks, and third-party calls each stretch recovery in distributed systems. Each driver has a matching reduction tactic, from deeper observability signals to error-budget alerting.

Where the MTTR average misleads

Averaging skewed, long-tail incident durations hides the one outage that hurt users behind dozens of quick fixes. Percentiles and distributions describe reliability better than a single mean.

From MTTR to user-impact metrics with SLOs

Measure recovery by user impact instead of engineer speed: error budget burn, service level indicator (SLI) degradation, and time to budget recovery, the duration a service stays out of SLO compliance.

Customer-Facing Reliability Powered by Service-Level Objectives

Service Availability Powered by Service-Level Objectives

Learn More

Integrate with your existing monitoring tools to create simple and composite SLOs

Rely on patented algorithms to calculate accurate and trustworthy SLOs

Fast forward historical data to define accurate SLOs and SLIs in minutes

What mean time to repair actually measures

The metric predates software operations. It comes from hardware maintenance, where it measures the average time a technician spends returning a failed component to working order, from the start of repair work to verified function.

Software teams borrowed the acronym and quietly changed what it measures. In incident response, MTTR usually refers to mean time to recovery: the total time from the moment a failure begins to the moment service is restored for users. That is the sense DORA (DevOps Research and Assessment) popularized for its "time to restore service" metric, and it includes detection lag that the maintenance definition never counted.

Two more variants complicate things further. Mean time to respond starts the clock at the first alert rather than at the failure, which strips out detection time. The name is its own trap. Many readers hear "respond" as acknowledgment, but that segment already belongs to MTTA. In common incident management usage, the response clock keeps running until service is restored. Mean time to resolve keeps the clock running past restoration until the underlying cause is fixed well enough that the incident should not recur.

The table below shows why these cannot share a dataset.

Concept

Clock starts

Clock stops

Mean time to repair

Repair work begins

Component or service verified working

Mean time to recovery

Failure begins to impact the system

Service restored for users

Mean time to respond

First alert fires

Service restored for users

Mean time to resolve

Failure begins

Root cause fixed and recurrence addressed

Two overloaded siblings also appear in practice: MTTRS (mean time to restore service) in ITIL-flavored organizations, and MTTC (mean time to contain) in security operations. None of these is wrong. What is wrong is a dashboard that averages a "respond" number from PagerDuty with a "resolve" number from Jira and labels the result MTTR.

Key insight: Two teams reporting "MTTR" can differ by the entire detection window, and both can be internally consistent. Before benchmarking against anyone, including your own past quarters, write down which R you track and where its clock starts and stops.

The MTTR formula and what the calculation includes

The formula is simple, and that is the trap. Divide the total time spent on repairs in a period by the number of repairs in that period:

MTTR = total repair time / number of repairs
Example: five incidents in a month
Repair durations: 30 + 45 + 60 + 90 + 135 = 360 minutes
MTTR = 360 / 5 = 72
minutes

The arithmetic takes seconds. The definitional work is deciding what "repair time" contains, and that decision changes the answer more than any process improvement will.

Consider the 135-minute incident above. If the failure started 40 minutes before anyone noticed, does the clock include those 40 minutes? If the fix was deployed at minute 100 but verification ran another 35 minutes before the incident was closed, does verification count?

Include detection and verification, and the incident is 175 minutes. Exclude both, and it is 100: same outage, same team, a 75% swing in the reported number.

A defensible calculation states which phases count. For a recovery-sense MTTR, the honest boundary runs from the start of user impact through detection, diagnosis, fix, and verification, because users experienced all of it. For a repair-sense MTTR, starting at diagnosis is reasonable, as long as detection lag is tracked separately rather than dropped.

Exclusions distort comparisons just as much. The maintenance world has a standard caveat here: MTTR conventionally excludes lead time for parts, so a pump that waited two weeks for a replacement seal still shows a two-hour repair. The software equivalents are change-approval queues, vendor support tickets, and waiting for a database administrator in another timezone.

Excluding them is defensible, but the exclusions must be visible. A report that silently drops an eight-hour approval wait describes a different incident than the one users lived through.

Key insight: MTTR is not a single number with a universally agreed-upon definition. It is a family of numbers separated by boundary choices. A one-page metric spec that names the start event, stop event, and exclusions does more for comparability than any tooling purchase.

Customer-Facing Reliability Powered by Service-Level Objectives

Service Availability Powered by Service-Level Objectives

Learn More

How MTTR fits the incident timeline

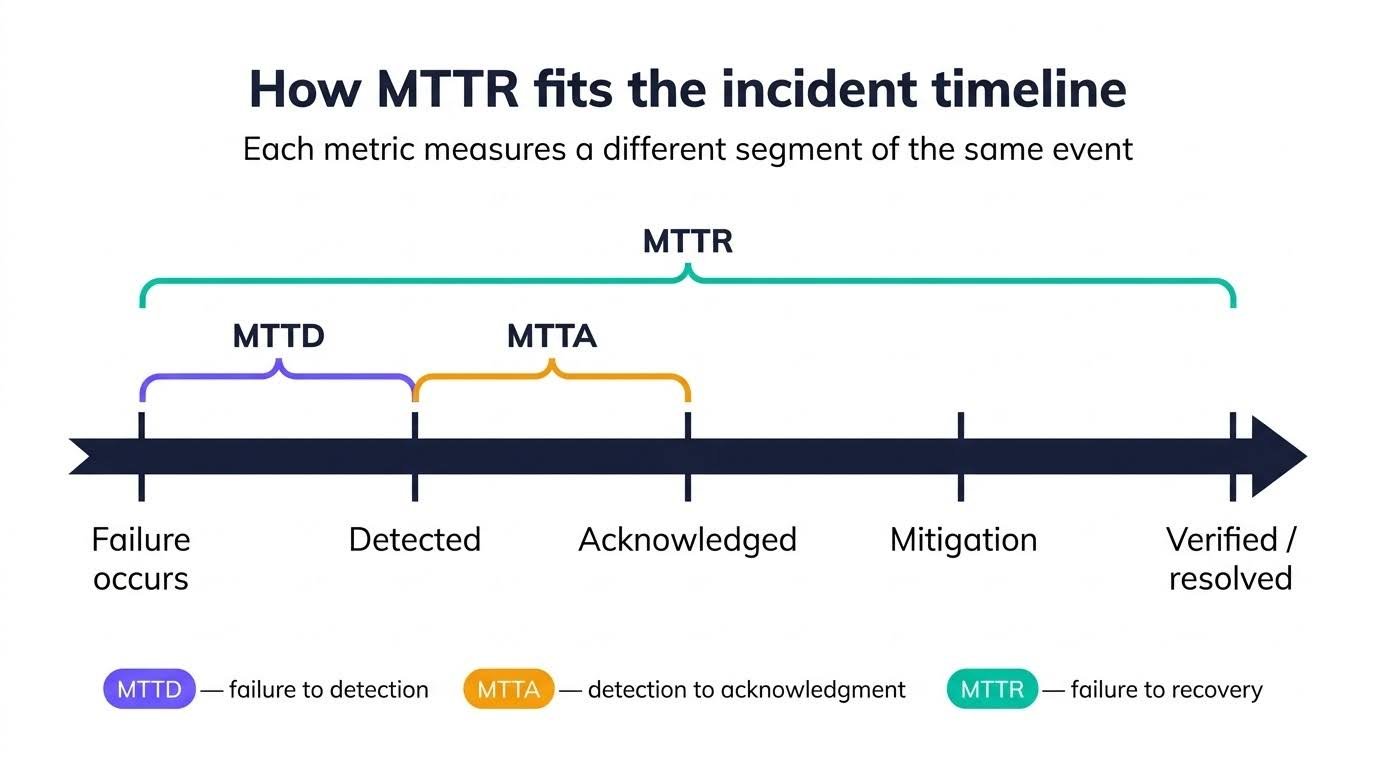
MTTR is one segment of a longer timeline of SRE metrics, not the whole story. A production incident moves through distinct phases: the failure occurs, users start feeling the impact, monitoring detects it, a human acknowledges the page, responders diagnose and repair it, the service recovers, and follow-up work resolves the root cause. Each boundary has its own metric, and confusing them is how a team spends a quarter optimizing the wrong gap.
mttr-incident-timeline

MTTR in the incident timeline. MTTD, MTTA, and MTTR map to distinct phases from failure detection through root cause resolution. Each metric measures a different slice of the same event.

Mean time to detect (MTTD) is the time between when a failure starts and when the monitoring catches it. Mean time to acknowledge (MTTA) is the time between when an alert fires and a responder picks it up.

MTTR, in its recovery sense, spans from failure to service restoration, so it includes both of the preceding segments. That containment matters: a team with a 90-minute MTTR and a 60-minute MTTD does not have a repair problem. It has a detection problem with a repair metric.

Two related metrics describe reliability between incidents rather than during them. Mean time between failures (MTBF) measures the average time between failures for repairable systems. Mean time to failure (MTTF) is the equivalent for components that get replaced rather than repaired, such as disks.

MTBF and MTTR together produce the classic availability formula: availability = MTBF / (MTBF + MTTR). A service that fails every 400 hours and recovers in one hour achieves 400 / 401, or 99.75 percent.

Metric

What it measures

Typical use

MTTD

Failure start to detect

Monitoring and alerting coverage

MTTA

Alert to human acknowledgment

On-call responsiveness and paging quality

MTTR

Failure or alert to recovery

Incident response effectiveness

MTBF

Interval between failures

System stability, repairable systems

MTTF

Lifespan until failure

Hardware planning, non-repairable parts

Keeping these timestamps accurate by hand is where most teams fail, because ticket fields get edited after the fact. One fix comes from service level objectives (SLOs), the reliability targets measured from user experience that the final section covers in depth.

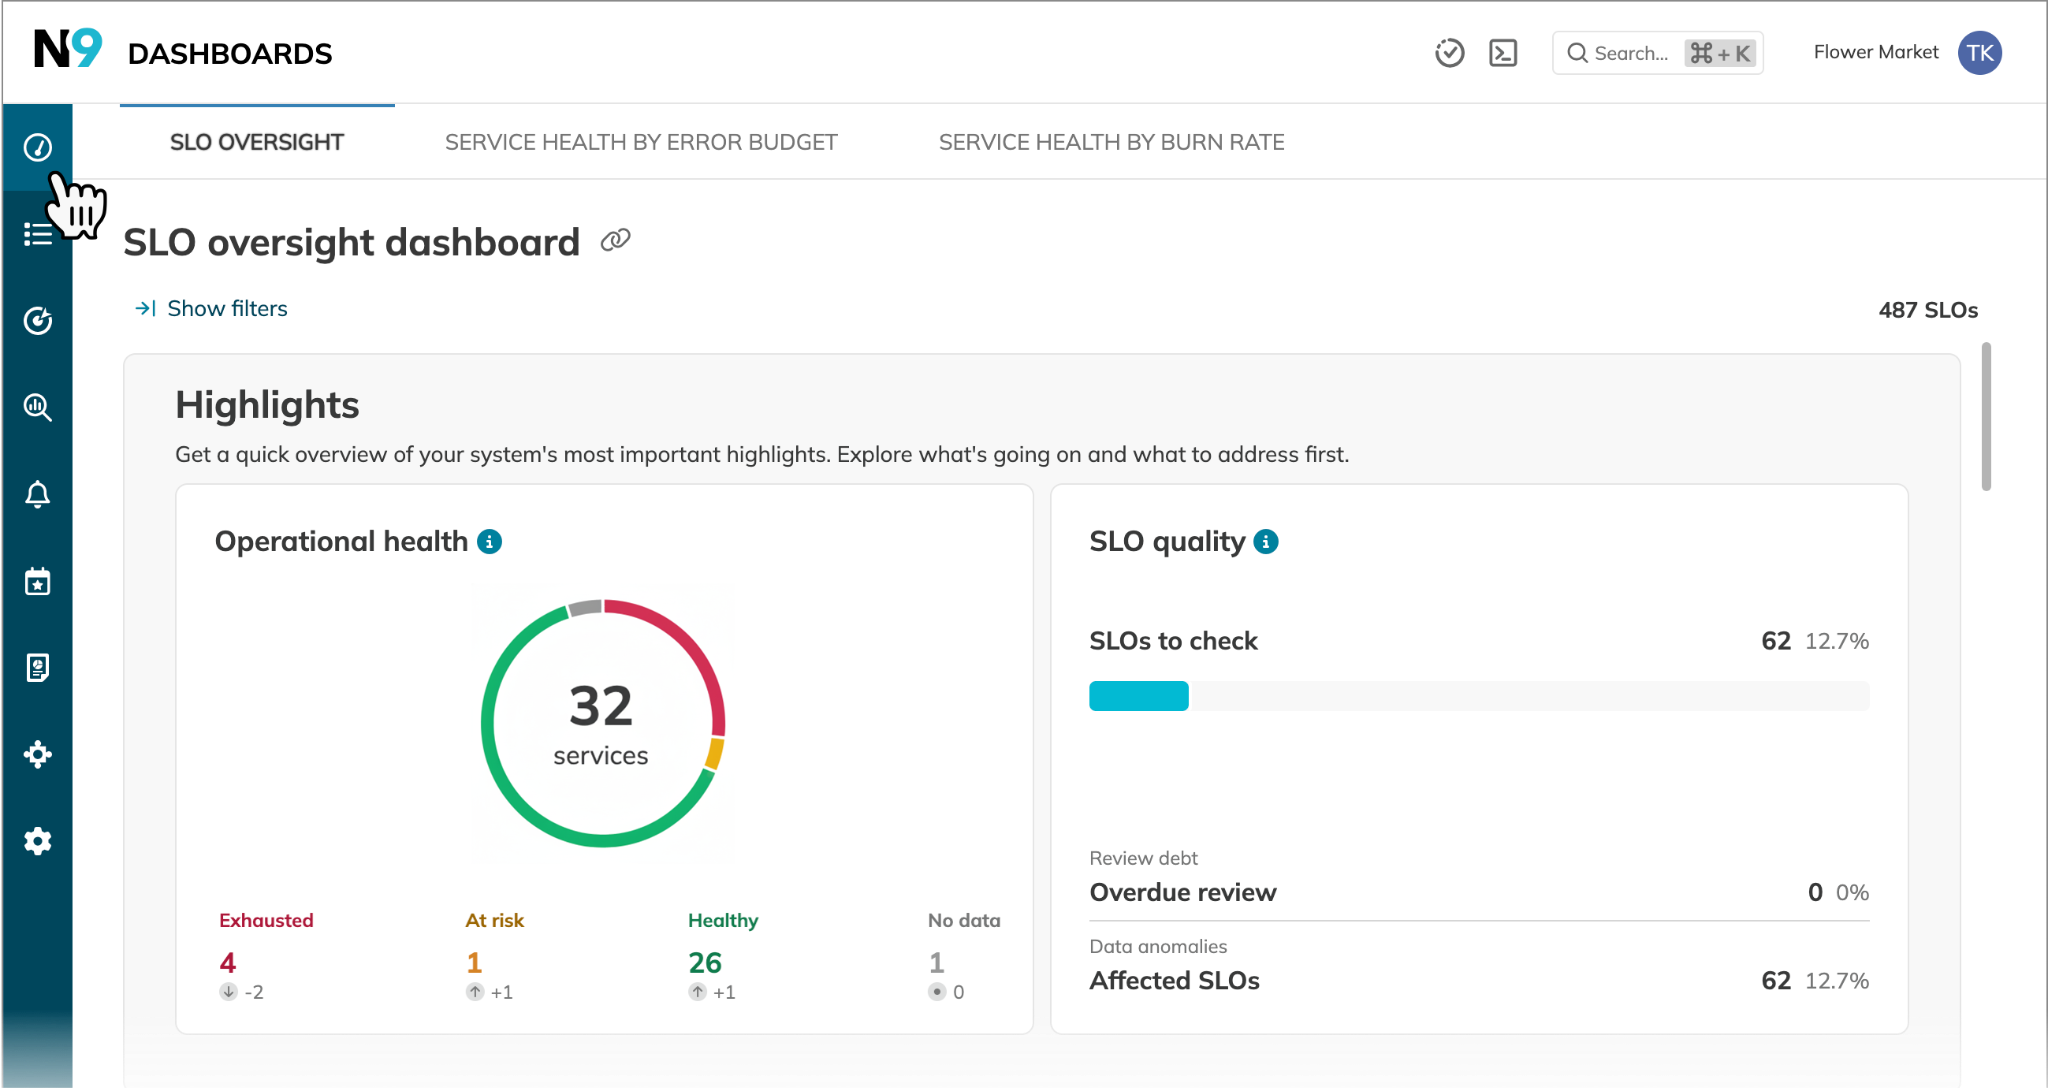
Because an SLO platform already monitors the measured service level, it can record the incident against that signal rather than as a ticket. Nobl9 takes this approach by annotating incident events on the SLO timeline, marking when impact began, when mitigation started, and when recovery was completed.
slo-oversight-dashboard

Nobl9 SLO details view with Operational health and SLO quality details

Key insight: Availability math makes the trade visible: halving MTTR and doubling MTBF yield similar availability gains, but they require different investments. Measure MTTD, MTTA, and MTTR separately before deciding which segment deserves the engineering time.

What inflates MTTR and how to bring it down

Recovery time is rarely slow for one reason. In a distributed system, the clock spans segments owned by different teams and vendors, and each driver has its own countermeasure. Generic advice to "automate more" fails because it does not say which segment it shortens.

The five drivers that show up in most retrospectives:

  • Service dependencies. A checkout failure that originates three services upstream forces responders to walk the dependency chain by hand. Distributed tracing through OpenTelemetry, plus automated correlation in the observability platform, turns that walk into a query.
  • Alert noise. When a single database stall fires 40 alerts across dependent services, responders spend the first 20 minutes triaging pages instead of diagnosing. Deduplication and severity routing help; so does alerting on user-facing symptoms rather than every internal threshold.
  • Manual diagnosis. Teams relying on log spelunking without metrics, events, logs, and traces (the MELT signals) rediscover the system's structure during every incident. Investing in dashboards per service, wired to the service level indicators (SLIs) that matter, shortens the search.
  • Stale runbooks. A runbook that references a decommissioned host costs more than no runbook, because responders trust it before they verify it. Reviewing runbooks as part of each post-incident review keeps them aligned with reality.
  • Third-party calls. A payment provider's degradation cannot be fixed from within your system. Timeouts, circuit breakers, and a documented fallback path convert an external outage into an internal degradation you control.

Detection deserves specific attention because it sits at the front of the timeline. Threshold alerts defined in Prometheus work, but static thresholds trade false alarms against missed incidents:

- alert: HighOrderErrors
expr: rate(order_errors_total[5m]) / rate(orders_total[5m]) > 0.01
for: 5m
labels:
severity: critical
annotations:
summary: "Order error rate above 1% for 5 minutes"


The most reliable approach most reliability teams land on is alerting on error budget burn rather than raw thresholds, an approach implemented in platforms like Nobl9, Datadog, and New Relic. A burn-rate alert pages only when errors are consuming the reliability budget fast enough to threaten the objective, which cuts the false pages that stretch diagnosis time and erode on-call trust.

Key insight: Alert noise indirectly but measurably inflates MTTR: every false page trains responders to acknowledge slowly, which shows up in MTTA before anywhere else. Fixing alert quality often improves recovery time more than faster remediation tooling.

Where MTTR misleads and identifying credible benchmarks

A single average over incident durations is statistically fragile. Incident lengths are not normally distributed. They are skewed and long-tailed: many quick fixes, a few grinding outages. Outliers can significantly skew the mean of such a distribution and dilute the value of mean-focused metrics.

A team that resolves 60 routine tickets in 20 minutes each and suffers one 9-hour outage reports a monthly MTTR of about 29 minutes. The number looks healthy. The one incident users will remember for months is invisible inside it.

The problem compounds because most teams have few real incidents. With five or six incidents a month, a single unusual event moves the mean by a factor of two, so quarter-over-quarter MTTR trends often measure luck rather than improvement.

The fix is to report the distribution. Median duration answers "what does a typical incident cost us?" The 90th percentile and the single worst incident answer "what happens when it goes badly," which is the question leadership is actually asking. A histogram of incident durations over two quarters tells a more honest story than a trend line of means.

For benchmarks, the most citable software-relevant source is DORA's "time to restore service" metric from the State of DevOps research, based on annual practitioner surveys:

DORA performance tier

Time to restore service

Elite

Repair work begins

Elite

Less than one hour

Medium

One day to one week

Low

Over six months

Treat these as orientation, not targets. They are self-reported survey buckets covering recovery from failed deployments, not measured incident data across all failure types. A "good" MTTR depends on your architecture, your traffic, and which R you are measuring. Any vendor quoting a universal good number is selling something.

Key insight: With small incident counts, the mean is the least stable statistic you can pick. Report median, p90, and the worst incident by name. If the summary must be a single number, the p90 is less than the average.

From MTTR to user-impact metrics with SLOs

Everything so far has measured how quickly engineers acted. None of it measures how long users suffered, and those are different questions. By the time repair work starts, user trust is already eroding. SLOs supply the user-centric perspective that MTTR lacks.

The mechanism takes three definitions. A service level indicator (SLI) is a measured signal of user experience, such as the fraction of requests that succeed. A service level objective (SLO) is the target for that signal over a window, such as 99.9 percent availability over 30 days. The error budget is the tolerance the target implies: 99.9 percent over 30 days allows 43.2 minutes of full downtime.

The budget converts a stopwatch reading into a cost. A 32-minute outage against that SLO burns roughly 74 percent of the monthly budget, a figure that says far more than "MTTR was 32 minutes."

Three SLO-aligned metrics translate incidents into user impact. Error budget burn states how much tolerance an incident consumed, as above.

SLI degradation indicates the real-time drop relative to the target. If 11,640 of 12,000 requests succeed during an incident, the service is running at 97 percent against a 99.5 percent objective. The gap quantifies severity while the incident is still open.

Time to budget recovery (TTBR) is the closest direct MTTR replacement: the total time a service remains out of SLO compliance, from the first breach until the SLIs return to target. TTBR keeps counting through failed fixes and premature all-clears. Closing the ticket does not stop this clock; only recovered user experience does.

TTBR also rewards the right engineering work. Take a team whose database failover required a manual runbook: TTBR measured two hours per event.

After automating the failover, TTBR dropped to 15 minutes. A ticket-based MTTR might have credited the on-call engineer's speed either way. TTBR credited the automation because it measures duration of impact, not effort.

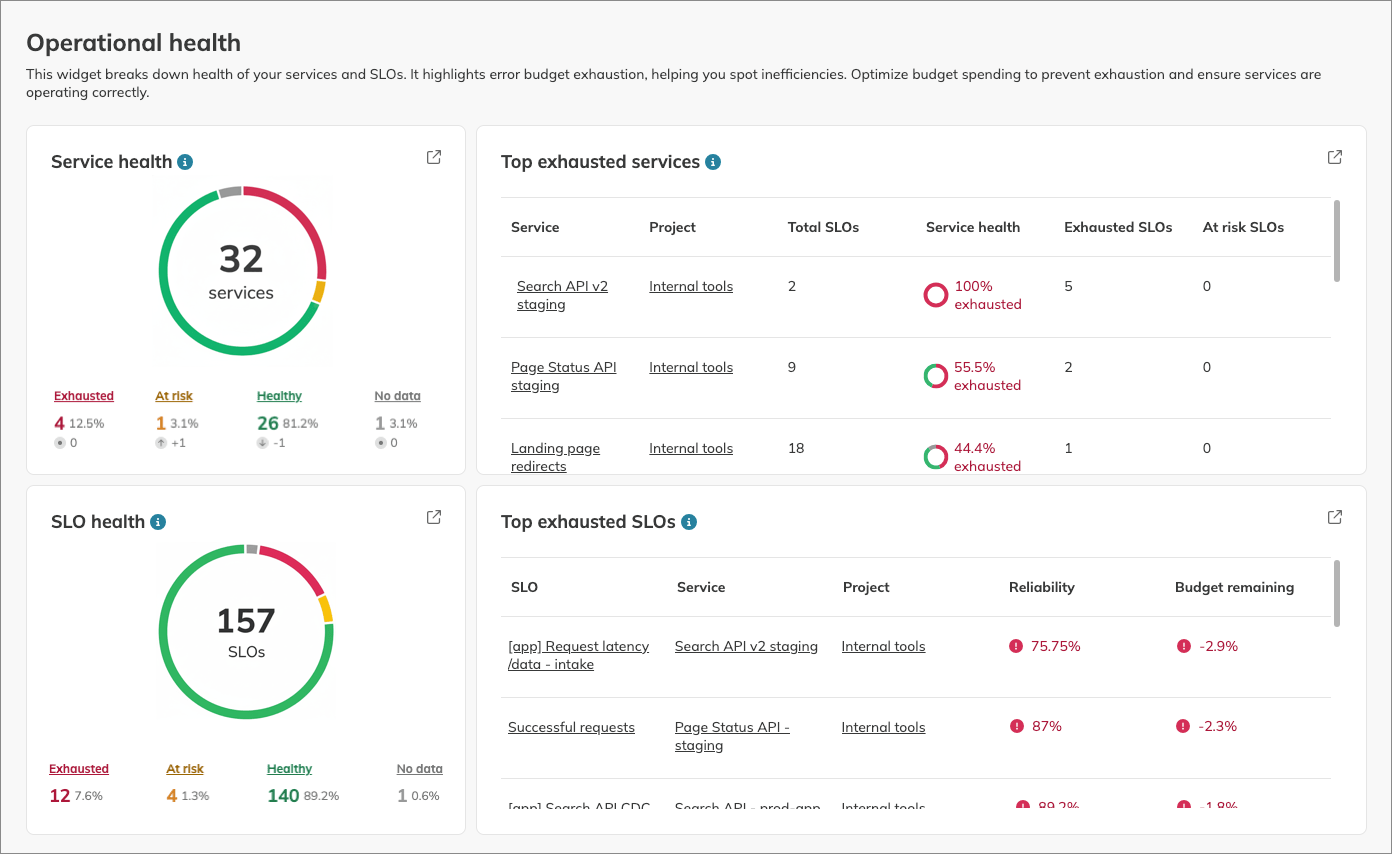
Making these metrics routine requires tooling that continuously monitors SLIs and keeps track of the budget. Nobl9 approaches this as an SLO layer over existing telemetry, computing TTBR from annotations on the SLO timeline and paging through multi-window burn-rate alerts that catch both fast spikes and slow leaks. Datadog, New Relic, Splunk, and Dynatrace offer SLO features within their monitoring suites, and the OpenSLO spec, along with the SLODLC templates at slodlc.com, provide teams with a vendor-neutral starting point for defining objectives as code. For a deeper treatment of the six SLO-aligned incident metrics, see the guide to incident response metrics.
slo-operational-health

Nobl9 Service Health Dashboard showing service health, SLO health, and extra details

Key insight: A 2x burn rate exhausts a 30-day budget in 15 days without a single dramatic outage. Burn-rate metrics catch the slow leak that never triggers an incident review, which is a failure mode MTTR cannot see because no repair ever happens.

Visit SLOcademy, our free SLO learning center

Visit SLOcademy. No Form.

Five actionable MTTR recommendations for incident response teams

Putting principle into action is necessary for effective incident response. With that in mind, here are five recommendations that pragmatically apply the MTTR concepts in this:

  1. Write a one-page metric spec. Name which R you track, the exact start and stop events, and every exclusion (approval waits, vendor time). Publish it next to the dashboard so no one benchmarks across definitions.
  2. Report the distribution, not the mean. Show median, p90, and the worst incident for the period. If stakeholders want one number, give them the p90 and say why.
  3. Automate the timestamps. Pull detection time from the monitoring system, acknowledgment from the paging tool, and recovery from the measured SLI, not from hand-edited ticket fields. Manually curated timelines drift toward flattering.
  4. Split MTTD out before optimizing repair. Measure detection lag separately for one quarter. Teams frequently discover that half their "recovery" time had elapsed before anyone knew about the failure, which redirects investment toward alerting quality.
  5. Pair MTTR with one SLO on one critical service. Define an SLI, set a target, and track error budget burn and TTBR per incident for a quarter alongside the legacy numbers. SLO-driven work tends to improve legacy metrics as a side effect, making the internal case for the shift easier.

Conclusion

MTTR remains an important aspect of incident response. It is familiar, easy to communicate to stakeholders, and useful as rough shorthand after an outage. The problem is treating a single average as a reliability verdict.

This article separated the four meanings behind the acronym, showed how boundary choices change the formula's output, placed MTTR on the incident timeline, and traced both the drivers that inflate recovery and the statistical reasons the average hides the outage that mattered.

High-performing incident response teams understand how to measure incidents from the user's perspective. Error budget burn shows how much tolerance an incident consumed, SLI degradation shows the real-time drop in success rate, and time to budget recovery shows how long users actually lived with a degraded service. SLO platforms make these metrics routine, and recovery speed still matters, but it is simply not the same as reliability. Teams that recognize this nuance in MTTR metrics and apply them as part of a broader, user-centric measurement strategy can consistently achieve high reliability and drive positive business outcomes in the long run.

Learn how 300 surveyed enterprises use SLOs

Download Report

Navigate Chapters:

Continue reading this series