-1.png)

To run a report you will need to configure a Filter and with the following fields:
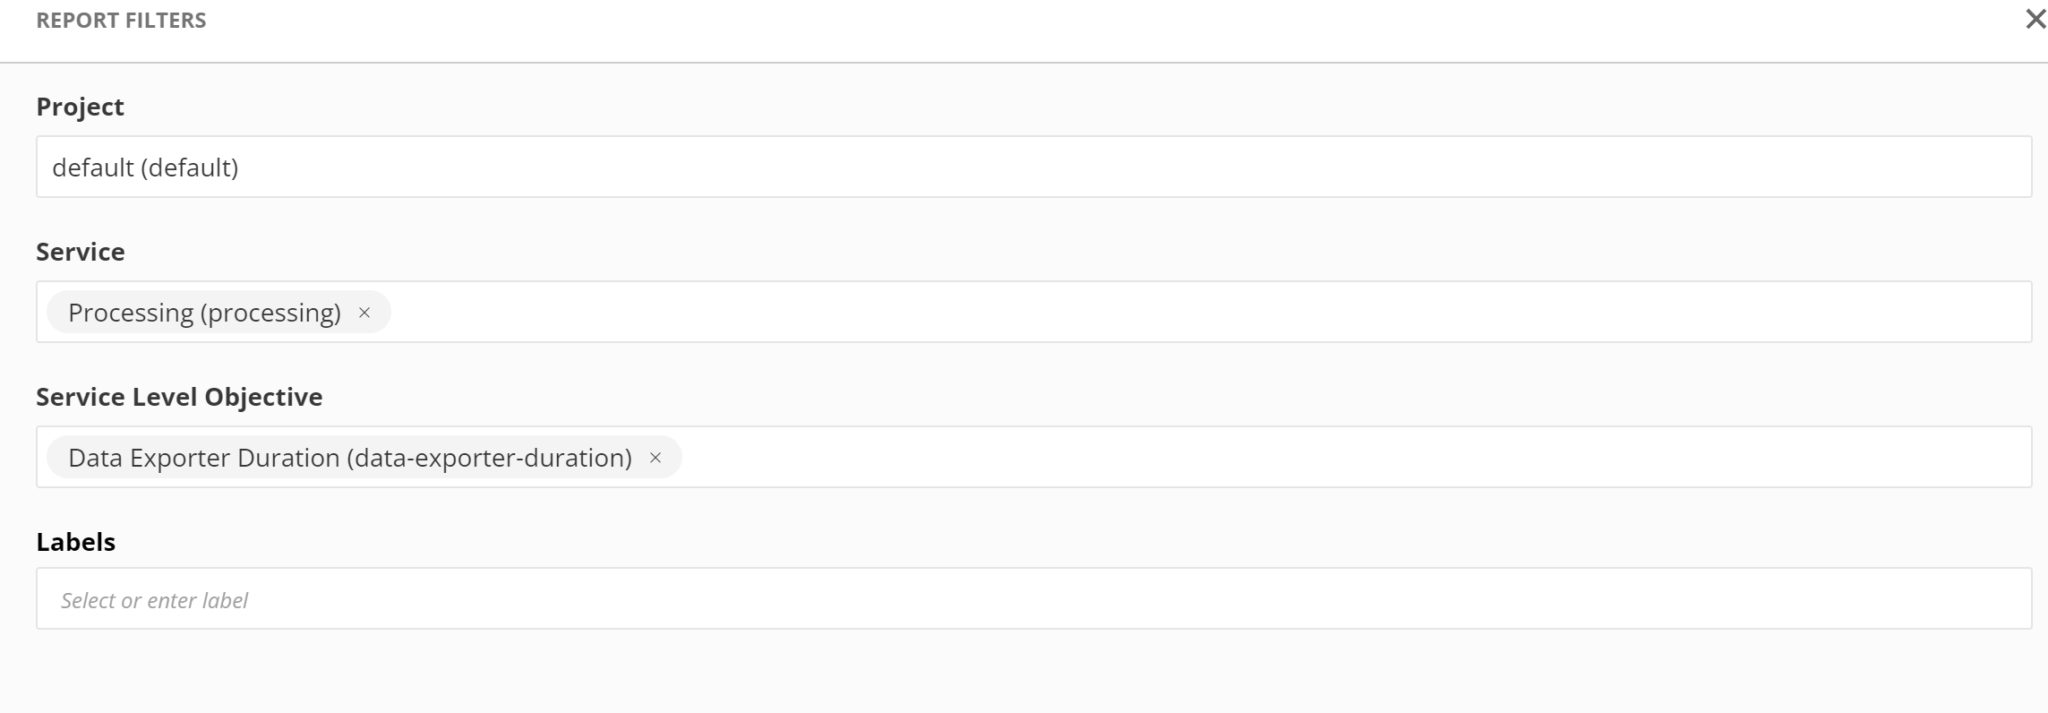
Nobl9 provides historical reports to give insights into your service level objectives. These reports show clear data-driven answers to critical questions like, "should we focus on features or technical debt?"
To run a report, navigate to the Reports page. There are several reports included:
To run a report you will need to configure a Filter and with the following fields:
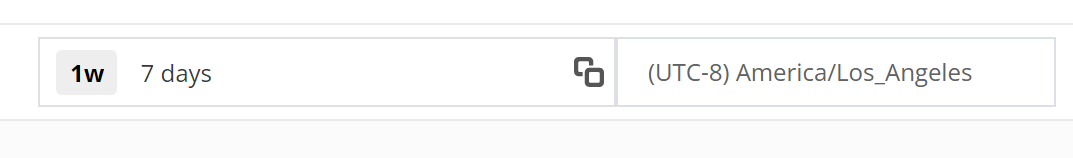
You can adjust the time window to different time periods ranging from 7 days to 1 year and specify the time zone you prefer.
The SLO Error Budget Status will provide a list of SLOs that match your filter.
The SLO History Reports will look like the following:
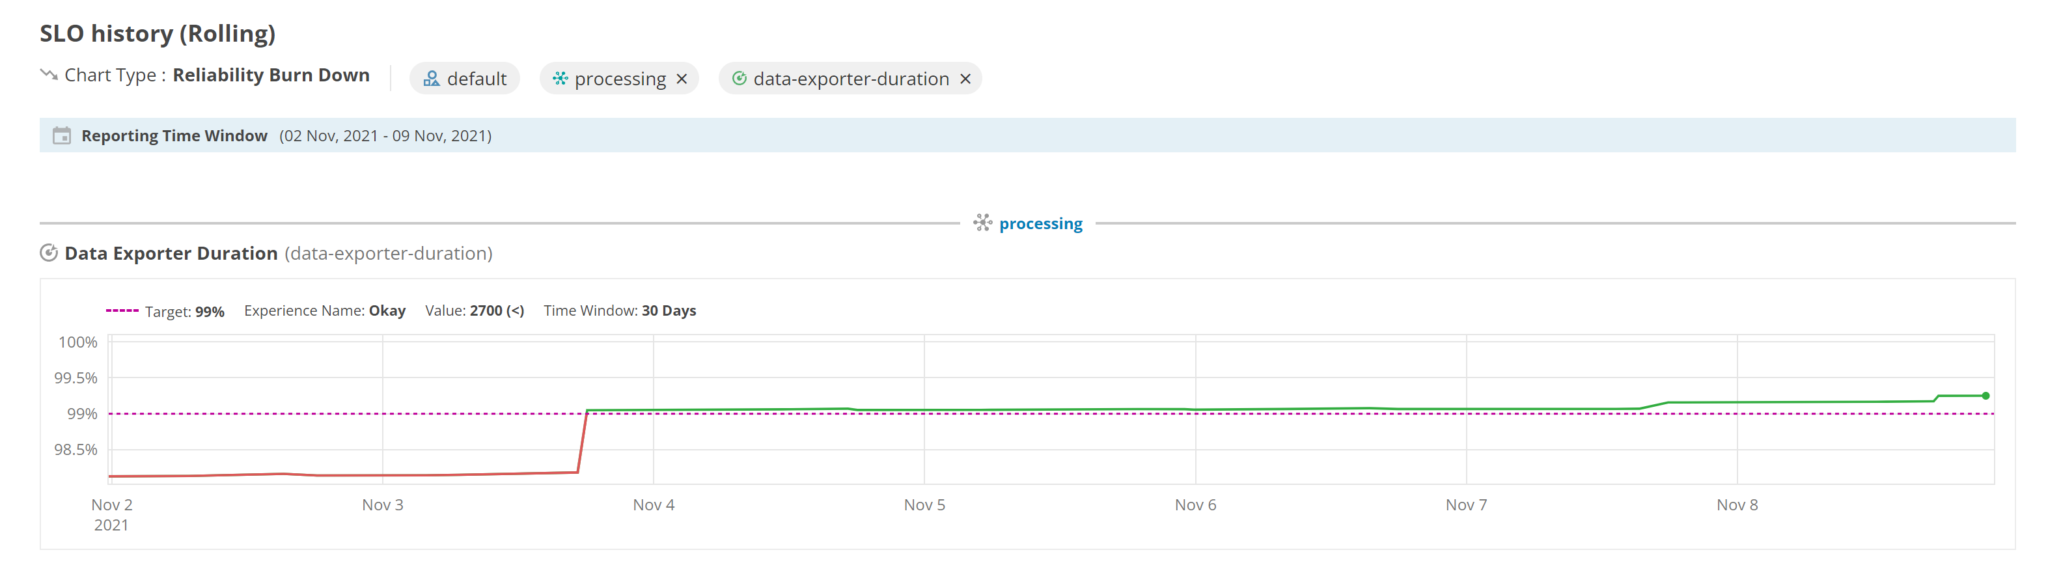
You can select the SLO to get a Detailed Error Budget Report showing the Service Level Indicator, the Reliability Burn Down, and the Error Budget Burn Rate. You can highlight a section of the graph to zoom in.
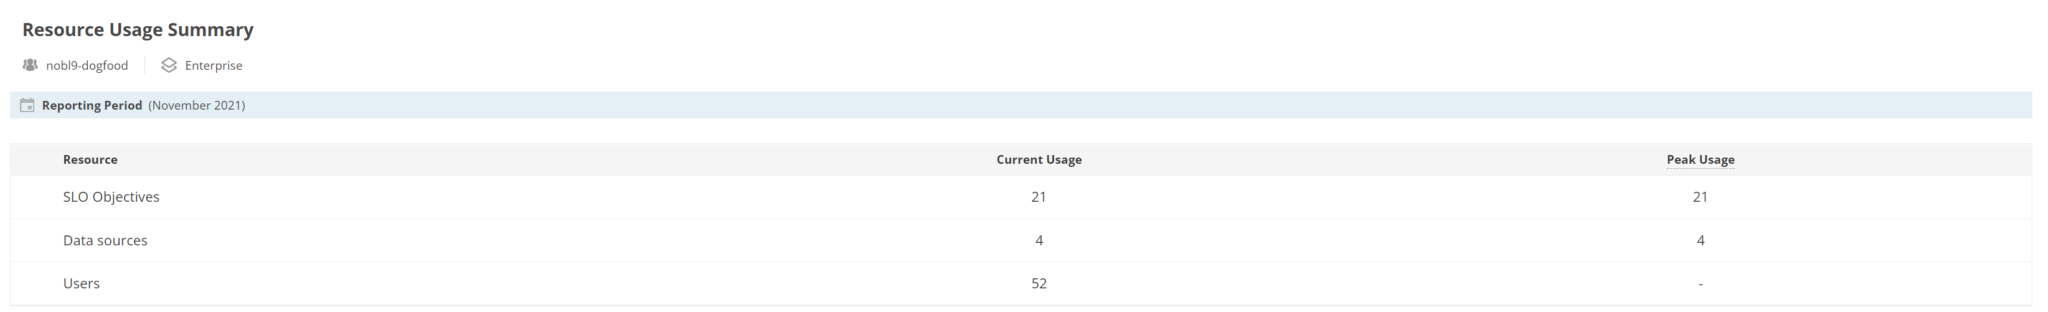
The Resource Usage Summary shows the resources that are being used in your NOBL9 instance and the peak usage.