
Table of Contents

Engineering teams often reference terms like availability, fault tolerance, and resilience when delivering digital services at scale. While most developers recognize these terms, few know how to apply them in daily deployment workflows.

Software maintenance and operations are resource-intensive, accounting for about 70 percent of total software lifecycle costs. In contrast, initial development requires only a fraction of that budget. Maintaining service functionality over time is what consumes the most engineering resources.

Teams manage this ongoing maintenance by balancing external Service Level Agreements (SLAs) with internal Service Level Objectives (SLOs). SLAs establish legally binding commitments with customers, while SLOs guide internal development efforts. Together, they define the boundary between business agreements and engineering practices, turning reliability metrics into measurable, data-driven milestones.

This article examines the practical differences between SLAs and SLOs and how to use them to improve production environment stability.

NEW: Watch how you can use AI to Discover which SLIs to measure

Watch 3-min Video. No forms.

Summary of key concepts of SLO and SLA

Concept

Description

Service Level Objectives (SLOs)

An internal target, measured over a rolling window, uses user-focused indicators to set the minimum acceptable level for system performance.

Error budgets

The error budget is the allowable margin for failure, calculated by subtracting the objective from 100 percent. It serves as a self-regulating guide for deployment risk.

Service Level Agreements (SLAs)

A formal, legally binding contract that requires a service provider to meet specific performance standards and imposes financial penalties for non-compliance.

SLA vs. SLO: Differences and the operational buffer

Agreements address external business risks for clients, while objectives support daily engineering operations. A strict performance buffer must be maintained between them.

Service Level Objectives (SLOs): The internal target and underlying metrics

A brief CPU spike or a quickly resolved node failure does not necessarily impact the end-user experience if the failure is mitigated at the infrastructure level. Relying solely on real-time infrastructure metrics wastes time responding to temporary alerts that do not affect your users.

An SLO is an internal target, measured over a rolling window, that uses user-focused indicators to set the minimum acceptable level for system performance. It provides an internal threshold to determine whether you need to take action or whether the system is operating within acceptable limits. It measures sustained service reliability over a rolling period, such as 7, 14, or 30 days, rather than forcing you to react to short-term spikes.

When setting realistic SLO targets, allow a small margin for failure. Requiring 100 percent uptime would prevent updates to dependencies, security patches, and product improvements.

Service Level Indicators (SLIs)

While the SLO defines your target percentage, the SLI is the formula and data stream you use to measure real-time performance against the SLO goal.

For example, for a typical web service availability metric, your SLI is calculated by dividing the number of successful responses (e.g., HTTP status codes under 400) by the total valid incoming requests over your chosen time window. This percentage gives the input for your internal SLO, ensuring you track direct customer impact rather than isolated backend load.

Selecting SLIs

When measuring SLI, how you aggregate data matters as much as the metric itself. Simple arithmetic averages hide edge case failures.

For example, if 99 of your requests complete in 10 milliseconds, but one stalls for 10 seconds, your average still appears acceptable. That single user, however, experiences a complete service failure. Using the 95th or 99th percentile highlights this tail latency and prevents surface-level metrics from hiding real slowdowns.

Another consideration is to avoid hardware metrics like CPU, memory, or container counts, as they do not reflect actual application performance for your users. Instead, focus on user-centric telemetry. If your internal targets focus on hardware metrics rather than customer impact, you may waste resources addressing systems that already function well for users.

Customer-Facing Reliability Powered by Service-Level Objectives

Service Availability Powered by Service-Level Objectives

Learn More

Integrate with your existing monitoring tools to create simple and composite SLOs

Rely on patented algorithms to calculate accurate and trustworthy SLOs

Fast forward historical data to define accurate SLOs and SLIs in minutes

Error budgets: The internal boundary for deployment risk

Subtracting your SLO from 100 percent determines the maximum number of failed requests your application can tolerate before breaching its target. This limit is your error budget.

For example, suppose a web service processes 10,000,000 valid requests over 30 days. The internal SLO target is 99.9 percent, setting the error budget at 100-99.9 = 0.1 percent.

To calculate the number of failed requests your system can tolerate, multiply the total request volume by the allowed failure rate:

10,000,000 * 0.1% = 10,000,000 * 0.001 = 10,000

Note: To convert a percentage to a decimal, divide by 100. In the above example, 0.1 percent becomes 0.001

This gives you a budget of 10,000 failed requests over 30 days. Each bad response, such as an HTTP 500 error, uses one unit of this budget.

If your application records 10,001 failed requests in a month, your error budget is exhausted, and your SLO is breached.

You can measure error budget as either the total number of allowed failed requests or the acceptable duration of downtime within a defined window.

Managing the budget

If the error budget is not fully depleted, you have a surplus. This surplus lets you deploy updates more frequently or test changes with a subset of users in production.

If the error budget is fully used, you must stop new feature releases and focus engineering efforts on stability. This means prioritizing bug fixes, testing improvements, and infrastructure checks until SLO recovers.

Also, clearly defined error budgets help resolve conflicts between product teams wanting new features and operations teams focused on stability.

Customer-Facing Reliability Powered by Service-Level Objectives

Service Availability Powered by Service-Level Objectives

Learn More
Service Level Agreements (SLAs): The external contractual commitment

A service level agreement is a legal contract that requires you to meet specific performance metrics for external customers.

An SLO is an internal target that guides engineering efforts, while the SLA sets the minimum performance your customers are legally entitled to expect.

To safeguard your business, you should always set your external SLA target lower than your internal SLO.

For instance, if your internal SLO requires a 99.9 percent availability rate (allowing 43 minutes and 12 seconds of monthly downtime), you might set your external SLA at 99.5 percent (allowing 3 hours and 36 minutes of downtime). This gap provides a safety buffer, allowing you to respond before system issues affect your external legal commitments.

Note: These targets are calculated by multiplying the allowed error percentage (0.1 percent and 0.5 percent) by 43,200 minutes (720 hours) in a standard 30-day month.

Consequences of SLA breaching

Violating an SLA might result in financial penalties, typically issued as service credits, billing discounts, or refunds. The breach tier defines the amounts.

For example, a contract may specify a 10 percent credit if monthly availability falls below 99 percent but stays above 95 percent, increasing to 25 percent if it drops below 95 percent.

Because SLA compliance affects revenue, these metrics require strict auditing and legally binding definitions.

Standard errors vs. excludable events

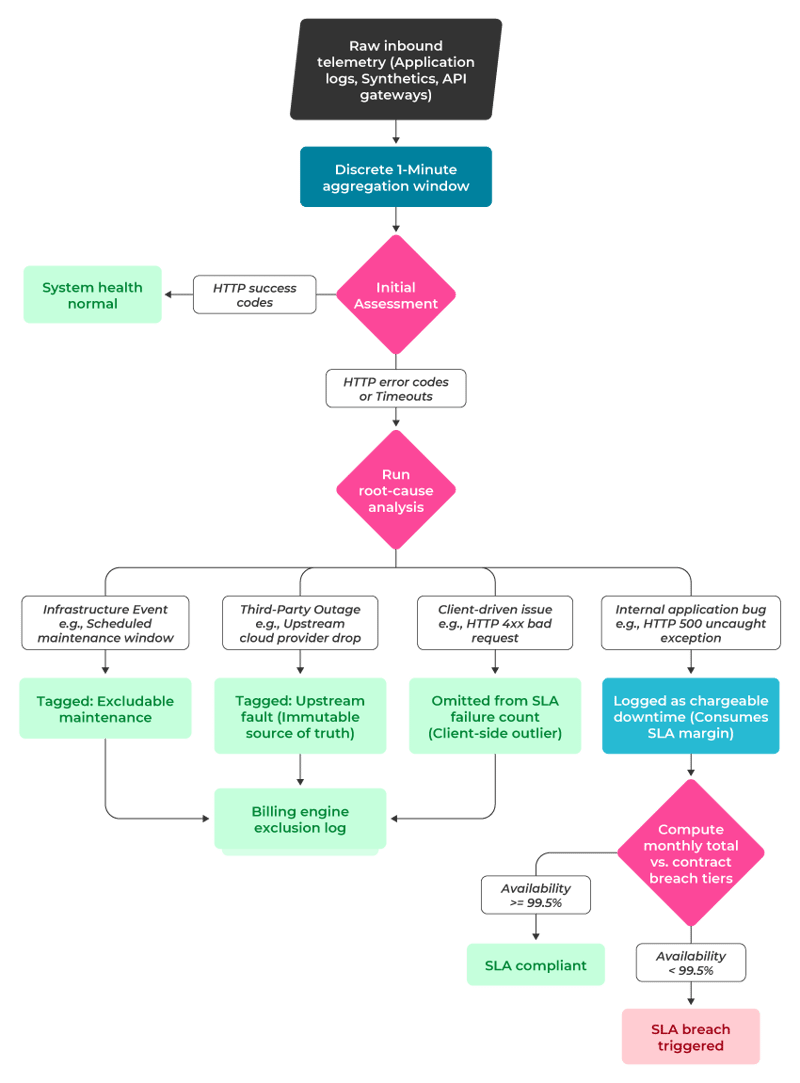
You must configure your infrastructure to distinguish between standard errors and excludable events, such as scheduled maintenance or third-party failures. Your monitoring stack must provide a verified, immutable source of truth for these metrics to resolve potential disputes over uptime/availability calculations.

For example, if an enterprise customer experiences a 30-minute outage, your monitoring stack should tag the affected time window using custom metadata or telemetry. If root cause analysis shows the downtime was due to a major cloud provider’s outage rather than your application, it is an excludable third-party failure. This verified classification allows your billing engine to exclude the 30 minutes from defined monthly SLA calculations, preventing unnecessary service credits.
automated-telemetry

Automated telemetry filtering & SLA exclusion flow

For your internal applications, you do not require formal SLAs, as there is no contractual financial liability. Instead, internal dependencies use SLOs and shared error budgets to maintain reliability, allowing you to prioritize stability based on technical needs.

SLA vs. SLO: Differences and the operational buffer

The SLA vs. SLO comparison matrix below defines the technical, legal, and operational boundaries between external contract commitments and internal targets.

Recognizing these differences will help you configure monitoring infrastructure correctly and avoid financial liability.

Operational Dimension

Service Level Agreement (SLA)

Service Level Objective (SLO)

Primary intent

Sets the legally binding minimum for system performance to manage financial risk with external clients.

Specifies the optimal reliability target to balance feature delivery speed with acceptable failure rates.

Typical target (Availability)

Represents the lower threshold, such as 99.5%, which allows up to 3 hours and 36 minutes of downtime per 30 days.

Represents the higher threshold, such as 99.9%, which permits a maximum of 43 minutes and 12 seconds of downtime per 30 days.

Measurement window

Uses fixed, retrospective billing periods, such as a calendar month or quarter, for compliance auditing.

Applies rolling compliance windows, such as the trailing 7, 28, or 30 days, to calculate real-time error budget consumption.

Aggregation interval

Uses coarse time-bucketing, typically in 1-minute or 5-minute intervals, to log valid outage periods.

Uses high-frequency metric sampling, such as per-second or per-request evaluation, through telemetry streams.

Data ingestion filter

Excludes events such as upstream cloud outages, client-side HTTP 4xx errors, and scheduled maintenance.

Monitors the actual user-facing experience, capturing both infrastructure faults and application-level issues.

Tooling dependency

Integrates with corporate billing systems, contract management databases, and legal audit logs.

Relies on operational observability stacks, time-series engines such as Prometheus, and paging systems.


Data immutability

Requires a high level of assurance; metrics must be approved, audit-logged, and retained for potential legal discovery or client disputes.

Is ephemeral; internal metrics may be re-indexed or adjusted as system architectures change.

Enforcement action

May trigger financial liabilities, including tiered service credits, billing discounts of 10% to 25%, or contractual refunds.

May trigger automated deployment blocks, CI pipeline freezes, or reallocation of resources to reliability improvements.

Managing SLO-driven reliability with Nobl9

Distributed architectures fragment operational telemetry across separate time-series databases and log aggregators. Tracking overall system health with isolated tools leads to visibility gaps and complicates centralized reliability monitoring.

A centralized platform such as Nobl9 addresses this fragmentation by normalizing SLIs from your existing monitoring tools, resulting in actionable SLOs.

Abstracting multi-source telemetry

Nobl9 ingests raw metrics using tool-specific native query languages and converts them into consistent data streams to provide a comprehensive view of reliability.

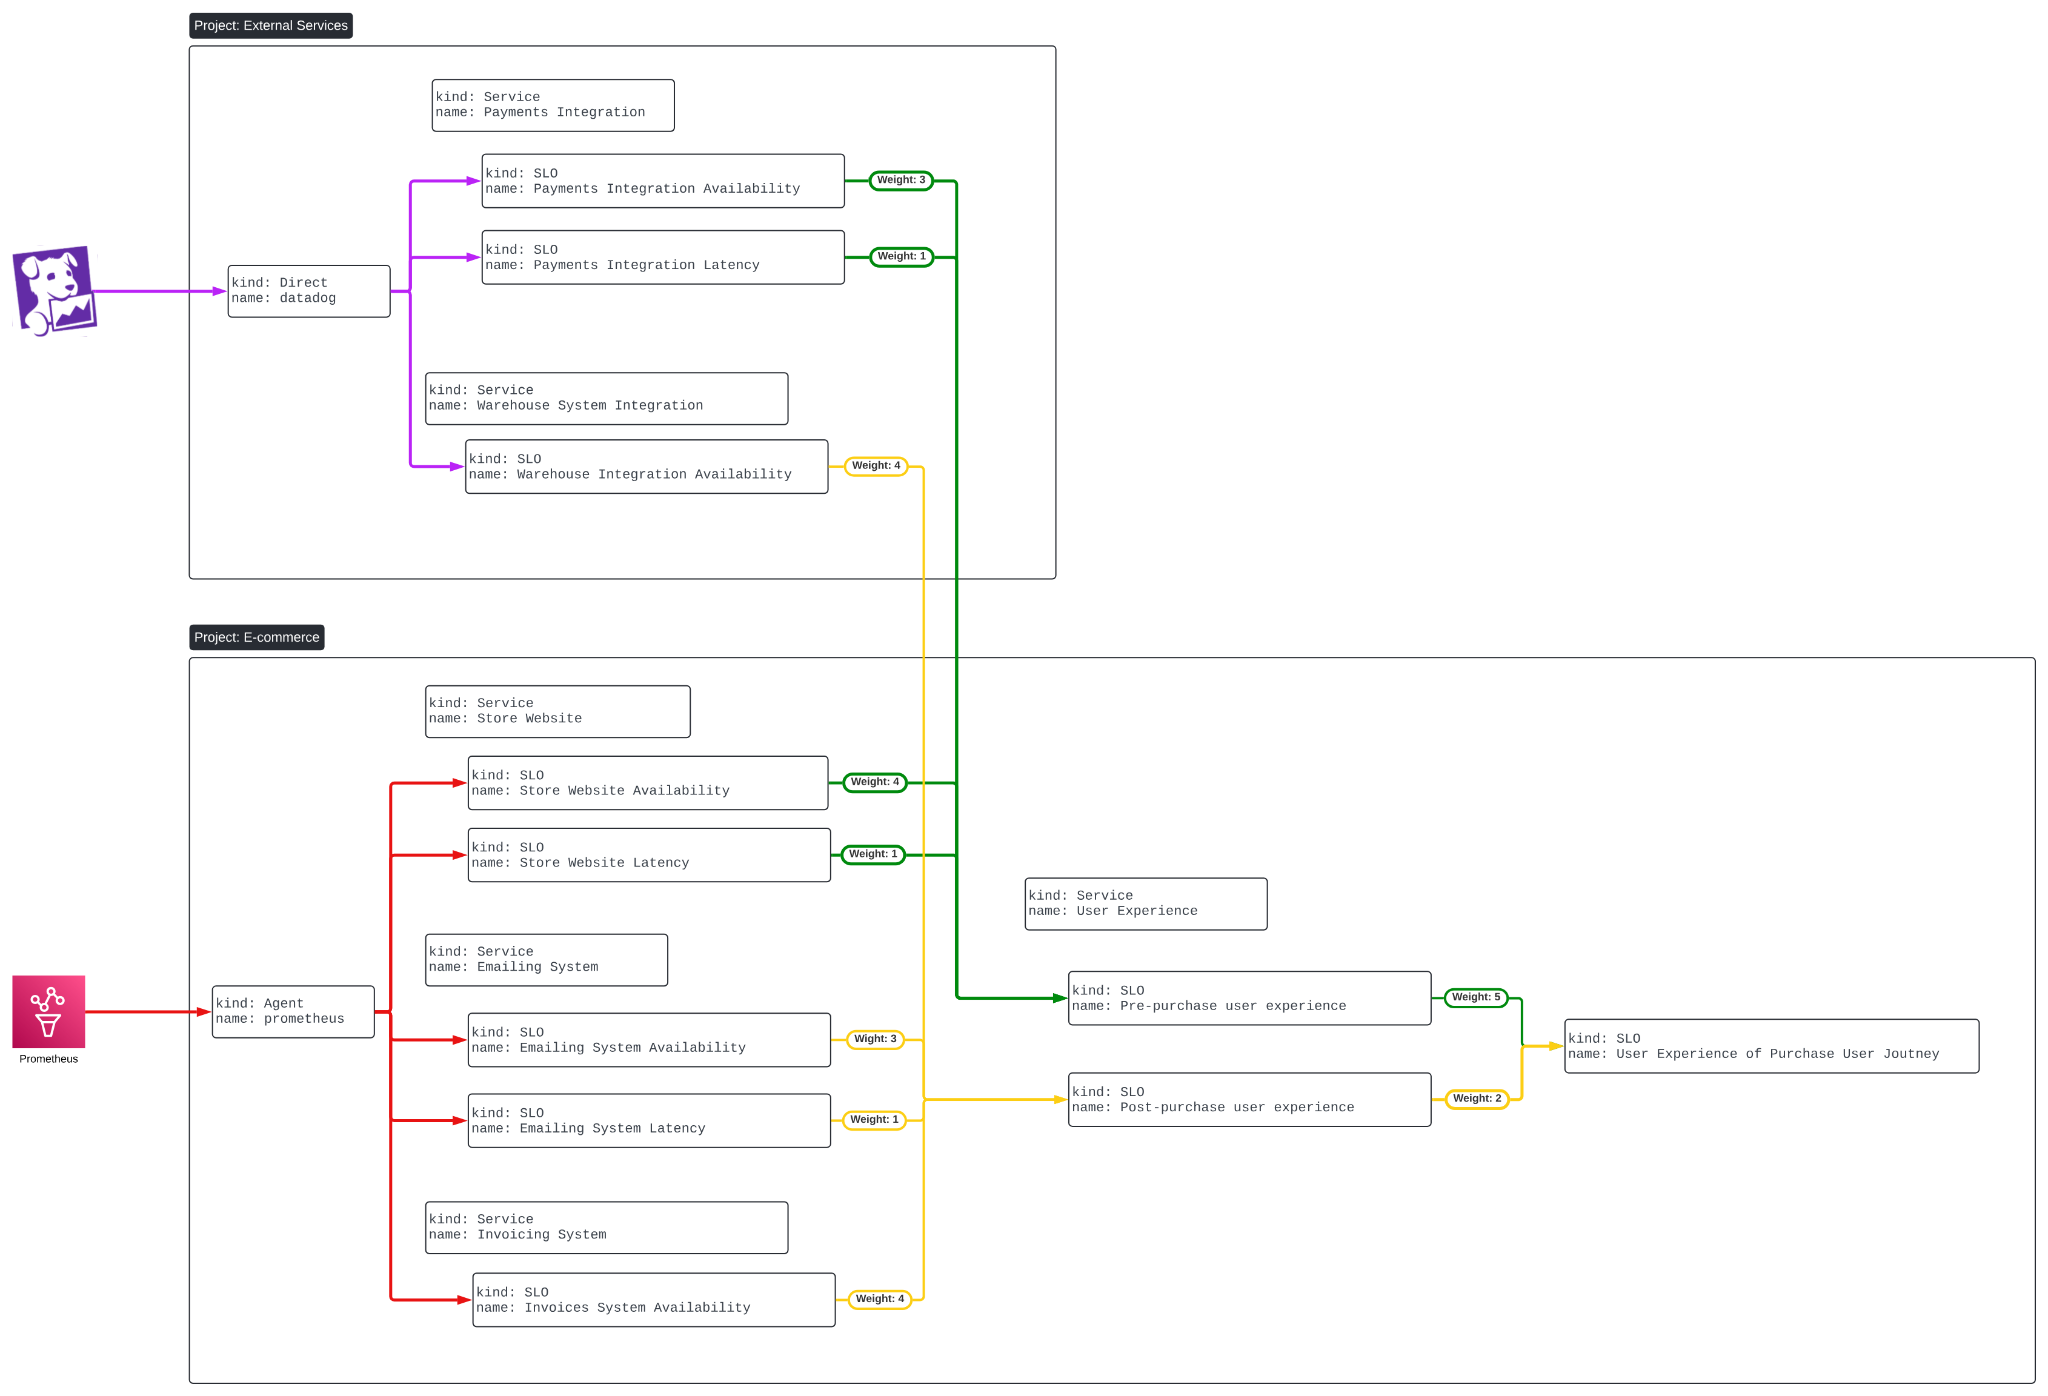
Composite SLO feature allows you to combine independent objectives from multiple sources into a single reliability metric. You can assign weights to each component based on its impact on user experience.

For example, to measure the pre-purchase user journey across environments, a composite SLO monitors both a self-hosted platform and an external integration through a telemetry stream. Each component is weighted according to its impact on users:

  • Store website availability: Weight of 4 (Highest impact; the site must be accessible)
  • Payment availability: Weight of 3 (Critical for checkout conversion)
  • Store website latency: Weight of 1 (Degrades experience but does not hard-block transactions)
  • Payments latency: Weight of 1 (Minor impact on the final checkout step)

Nobl9 combines metrics into a single, weighted reliability SLO that accurately represents the user experience before an order is placed.
composite-slo-creation

Creating composite SLO for pre-purchase user journey (Source)

Accelerating objective validation

Deploying new performance targets often requires weeks of live observation to determine if objectives are appropriately set.

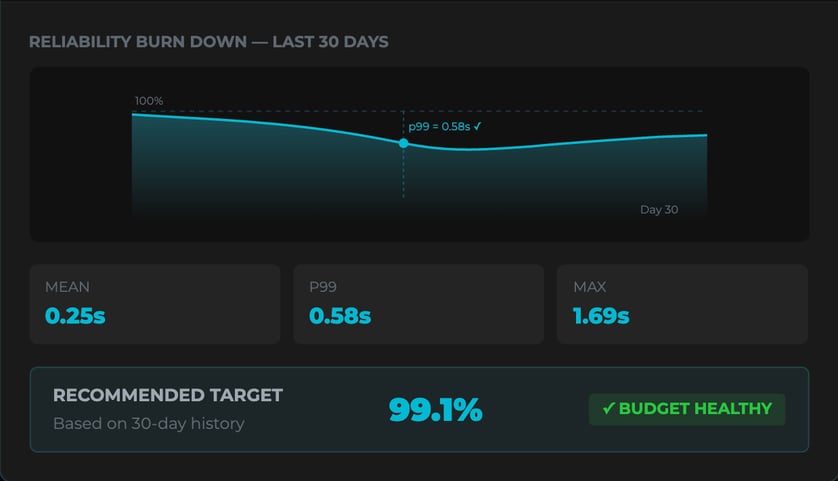
SLO Backtesting eliminates this delay by ingesting historical data directly from your existing time-series databases.

For instance, when migrating a core service from threshold alerts to objective-based monitoring, you can backtest up to 30 days of Prometheus metrics. The platform imports data to calculate benchmarks, including minimum, mean, maximum, and 99th percentiles for your SLIs.

The simulation plots raw time-series data against your target to generate a historical error-budget burn-down chart.

If the simulation shows that a 99.9 percent availability target would exhaust your budget due to routine maintenance, you can adjust the target to 99.5 percent before production tracking.
validating-slos


Validating SLOs with historical data (Source)

Automating lifecycle governance and diagnostics

As software and infrastructure change over time, static objectives are prone to operational drift. To ensure accountability, the platform assigns ownership at the objective level. It scans service metadata, logs review events with editable annotations, and sends tickets to the designated owner in the code definition.

This process requires you and your team to confirm that current thresholds align with infrastructure capabilities and to verify that data anomalies do not affect active error budgets.

Oversight

Automated SLO Oversight protects your reliability program by identifying outdated targets, tracking ownership, and ensuring regular reviews to keep configurations aligned with system changes.

For example, to prevent metric inaccuracies and maintain governance, the SLO Oversight continuously tracks active configuration states.

If a critical service objective has not been reviewed or updated within the set operational timeframe, it is flagged as a stale target.

Annotations

When service degradations occur, identifying the cause requires correlating infrastructure changes with metric fluctuations. SLO Annotations automate this process by overlaying event logs onto the error budget time graph. When actions such as code deployments, tool updates, or server restarts occur, these events are automatically linked to the timeline.

Visit SLOcademy, our free SLO learning center

Visit SLOcademy. No Form.

Conclusion

All software systems eventually experience failure. Unpredictable infrastructure, network disruptions, hardware degradation, and human errors make flawless operation unattainable.

Building a system with zero downtime is virtually impossible and limits your ability to deliver new features.

To manage this reality, service level agreements protect your business from legal and financial risk, while internal service level objectives guide day-to-day operations and manage deployment speed.

Maintaining a clear buffer between internal goals and customer commitments protects your business from risk and gives development teams the flexibility to deploy changes safely and maintain stability. Let customer experience guide your engineering efforts, so you prioritize resolving issues that truly affect users.

Learn how 300 surveyed enterprises use SLOs

Download Report

Navigate Chapters:

Continue reading this series