
-1.png)


A good Service Level Objective (SLO) enables you to understand what target level of reliability is optimal for your service’s customers. It sets a threshold above which most customers should be happy and below which you should consider investing more in improving reliability. However, setting reliability targets that reflect your business needs is not always straightforward. It takes time and effort and requires an understanding of how your system has performed historically. Typically, you create an SLO and iteratively adjust the target to arrive at the optimal value.
Working with our customers has taught us that while the SLO concept is relatively easy to understand, it’s challenging to master. Helping our customers improve their reliability through creating and tracking meaningful and actionable SLOs is one of the core goals of Nobl9. With that focus in mind, we developed a new tool: SLI Analyzer.
SLI Analyzer retrieves historical data from your system and performs statistical analyses for you. Using this data, you can set reliability targets and see how your system performs. Nobl9 simulates the SLO on the fly, showing you how much and when you will burn your error budget with the proposed settings. You can tweak the targets and view updated error budgets and reliability burn down. Once you’ve determined the right target, you can easily create a new SLO.
How can SLI Analyzer help you?
- SLI Analyzer makes creating your first SLOs easier. You can nearly instantly see the data you want to measure. By inspecting it, you can verify that your query is correct and returns what you envisioned.
- SLI Analyzer lets you review the outcome of your SLO before you create it, so you can test that your assumptions are correct before implementing it. This cuts out the lengthy trial and error process.
- SLI Analyzer allows you to understand your current reliability. Rather than implementing an SLO and needing to wait days or even weeks to gain a meaningful data sample to evaluate, you can leverage the data you already have in your monitoring solution to set an appropriate target.
- SLI Analyzer provides a visual and statistical analysis of your data, allowing you to find your ideal SLO settings faster and more easily.
- SLI Analyzer allows you to experiment and run simulations – what-if scenarios – without extra cost and wait time.
- With SLI Analyzer, you can analyze your past outages and set SLOs that will inform you about such problems in the future.
Using SLI Analyzer is a simple, two-step process
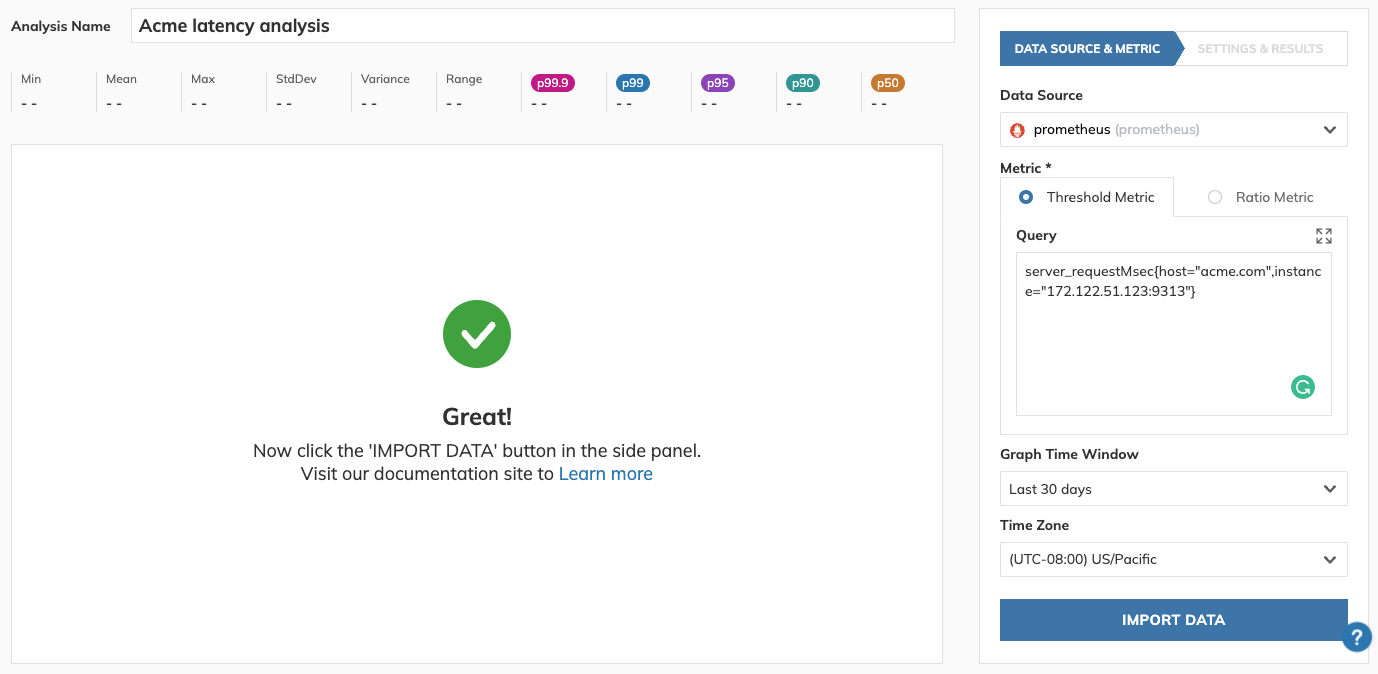
1. The first step is to set up the Service Level Indicator (SLI) you want to analyze. To do that, you need to create a new analysis and select the data source you would like to use. Then, provide the SLI definition in the form of a query or metric settings (depending on your data source). Finally, choose a time window, indicating how much past data you would like Nobl9 to pull. After you provide these settings, you can start the data import. As the data is being imported in the background, you can navigate away from the analysis. The time it takes to finish depends on the length of your selected Graph Time Window (up to a couple of minutes for large datasets).
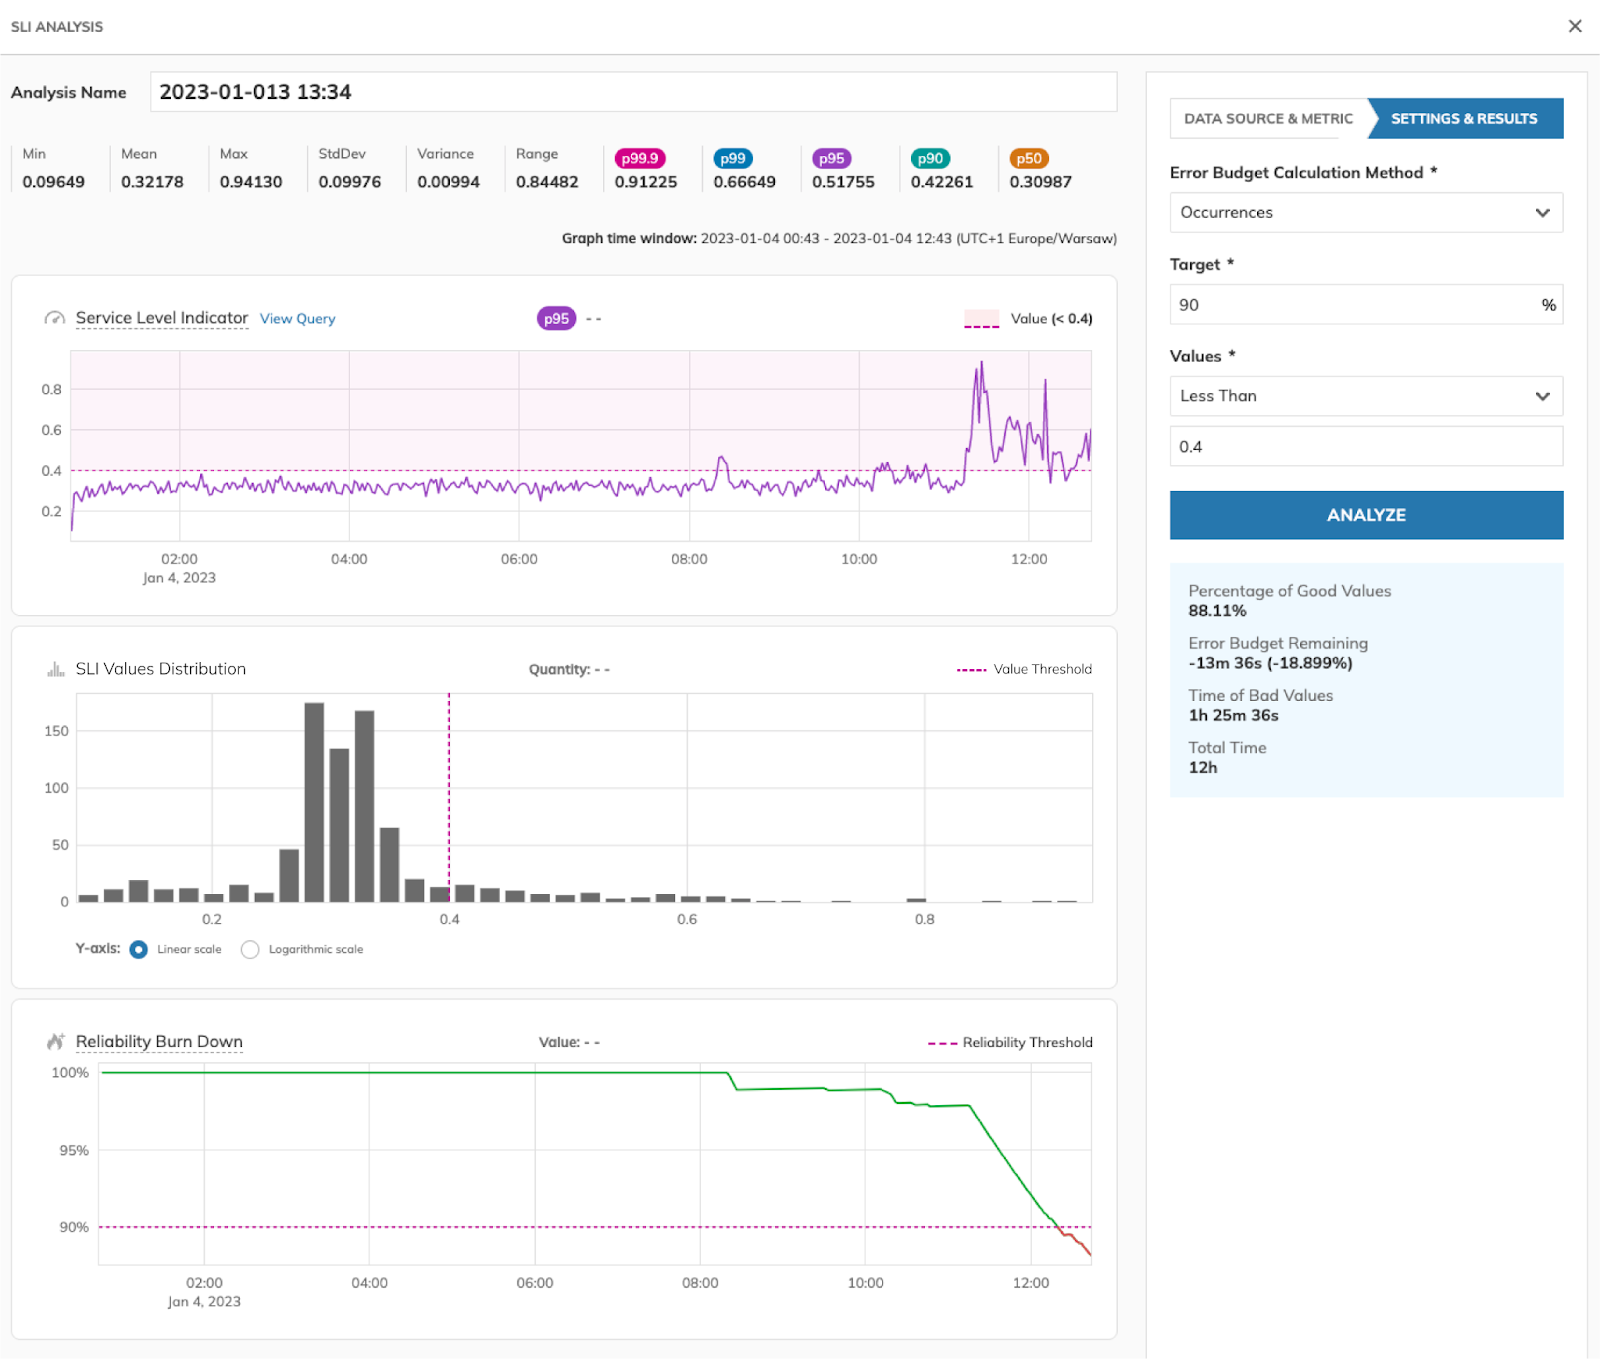
2. The second step is to simulate your error budget and reliability burn down. After successfully importing your data, you can begin to analyze it. Start by inspecting your SLI. Nobl9 presents the SLI data as a time-series graph showing how it has changed over time. You can also analyze the distribution of values on a histogram chart.
If you’re looking for a quick way of finding a starting threshold, you can use the provided statistical values (e.g., Mean, Max, P95, P99). With SLI Analyzer, you can calculate your error budget using both available methods: Occurrences and Timeslices. You can experiment with changing the targets, thresholds, and calculation methods to get the best results for your case.
Once you’ve determined the right settings, you can use them to create new SLOs!
SLI Analyzer currently supports the following data sources:
- Datadog
- Prometheus
- AMS Prometheus
- Splunk
- New Relic
- Amazon CloudWatch
- Graphite
Support for additional sources is expected to be added soon.
If you want to see the SLI Analyzer in action, check out this video demonstration. You can pull up to 30 days of historical data and discover and tune the right settings for your new SLO.
SLI Analyzer is now available for all Nobl9 customers. If you want to try Nobl9 and take your reliability to the next level, contact our team!
Share:


Do you want to add something? Leave a comment