
- Multi-chapter guide
- Service level objectives
- Slo software
SLO Best Practices: A Practical Guide
Table of Contents
Like this article?
Subscribe to our Linkedin Newsletter to receive more educational content
Subscribe nowProduction environments often distribute telemetry across multiple monitoring tools. Metrics are stored in Prometheus, logs in Grafana Loki, and traces in Jaeger. This fragmentation makes it difficult to create a unified, reliable view of system health.
SLO software gives you a clear, consistent way to measure reliability across services and user journeys. It does this by acting as an abstraction layer collecting raw data from your existing backends without requiring data migration or transformation. So you can define and centrally manage objectives that accurately reflect what users actually experience, regardless of where the underlying data lives.
This article outlines how to advance beyond basic uptime monitoring with centralized SLO software. You will learn how to unify fragmented telemetry, implement reliability-as-code, govern SLO adoption, and automate error budget policies.
Summary of key SLO software concepts
The tale below summarizes five SLO software concepts that this article explores in detail.
|
Concept |
Description |
|
Centralizing fragmented telemetry |
A centralized abstraction layer queries different monitoring backends to provide consistent, vendor-neutral success rates. |
|
Reliability-as-code |
Reliability targets act as programmable objects, aligning technical goals with version-controlled workflows. |
|
Technical math in SLO calculations |
Granular histograms, inverse percentiles, and time-slicing methods ensure that off-peak performance issues are visible and not masked by high-traffic periods. |
|
Managing SLO governance |
Ensure SLO reviews happen promptly and that SLO quality issues are proactively addressed. |
|
SLO-driven automated workflows |
Real-time error budget data allows automated decisions for deployment gates, resource allocation, and alert prioritization. |
Customer-Facing Reliability Powered by Service-Level Objectives
Service Availability Powered by Service-Level Objectives
Learn MoreIntegrate with your existing monitoring tools to create simple and composite SLOs
Rely on patented algorithms to calculate accurate and trustworthy SLOs
Fast forward historical data to define accurate SLOs and SLIs in minutes
Centralizing fragmented telemetry
To measure combined reliability, consider implementing an abstraction layer that connects to your telemetry tools and consolidates data from multiple sources into a single metric.
This section describes how SLO software serves as an abstraction layer, retrieves data without duplication, and standardizes different units into consistent success rates.
Connecting to distributed data sources
Manually correlating system health signals during production incidents is too slow to prevent breaches of user-facing operations.
Centralized SLO platforms address this bottleneck by querying monitoring backends directly through native API connectors. The connectors enable queries to run where data resides, removing the need for data migration, storage duplication, or ETL pipeline overhead.
This query-in-place model remains efficient even during major incidents. Instead of retrieving large volumes of raw log data or traces, the abstraction layer executes targeted queries to retrieve the required data. This also lets AI agents pinpoint root causes faster, without wading through noise.
It also creates a vendor-neutral strategy that applies across the industry. Whether using custom scripts or platforms, the architecture relies on stateless metric collection and treats backends as pluggable data providers.
For example, Nobl9 SLO management offers two secure connection strategies:
- For protected networks, a lightweight agent in your cluster pulls SLI data and sends it to the platform via outbound-only HTTPS, without requiring open inbound firewall ports.
- For cloud-hosted environments, the direct connection method queries telemetry backends directly via cross-account IAM roles.
Standardizing success rates
Raw telemetry data uses inherently incompatible data structures across different backend providers. A time-series database might express performance as a continuous floating-point metric, such as latency percentiles, while a logging platform captures string events, such as HTTP status codes.
SLO software resolves this structural mismatch by applying normalization logic that translates these varied data inputs into a uniform, percentage-based success rate equation.
For example, in Nobl9, this is handled through two primary calculation methods:
- Threshold metrics (Raw metrics): Evaluates a single continuous time-series stream against a mathematical operator (e.g., requests where latency is <=200ms are bucketed as “good”).
- Ratio metrics (Count metrics): Evaluates two distinct query streams using conditional boolean logic to count matching event instances (e.g., entries where log level does not equal ERROR are bucketed as “good”) over a total sample volume.
By evaluating these disparate data types strictly as pass/fail criteria within a specific time window, the platform fully abstracts from the underlying data format.
This approach allows both a legacy monolith that outputs raw events and a containerized microservice that provides high-precision histograms to be evaluated against the same reporting standard.
Decoupling objectives from monitoring tools
Embedding business logic directly into a single telemetry provider’s proprietary format ties your reliability metrics to that vendor’s query language and schema.
When alerting logic, dashboard configurations, and downstream automations are tightly coupled to native data formats, migrating to a different monitoring solution becomes an expensive and time-consuming project.
SLO platforms address this by introducing an abstraction layer between raw data and reliability definitions. The platform separates these concerns through a two-part configuration model:
- Core objective definition: The business logic, such as a 30-day rolling window and a 99.9% reliability target, is declared as a standalone, vendor-agnostic object.
- Pluggable data connector: The backend query syntax required to fetch raw data is treated as an interchangeable implementation detail.
Because the core objective definitions exist independently of the data collections, the downstream infrastructure remains stable. If you migrate your infrastructure from an enterprise SaaS monitoring tool to an open-source alternative like Prometheus, the migration is isolated within the data connector configuration.
Customer-Facing Reliability Powered by Service-Level Objectives
Service Availability Powered by Service-Level Objectives
Learn More
Reliability-as-code
Managing SLOs through a user interface is impractical for architectures with many services and environments.
This section explains how to define reliability targets in code by using error budgets as programmable API endpoints and managing them through version control.
API-driven management
Standard monitoring platforms restrict error budget data to a visual UI. An API-driven model replaces visual graphs with structured JSON responses. This approach makes reliability targets available as live, queryable URLs accessible through standard HTTP requests.
Deployment pipelines, orchestration scripts, or internal tools can query these endpoints to retrieve live burn rates. This data can then trigger automated actions, such as rolling back canary deployments or scaling containers, based on real-time platform stability.
For example, before executing the production CI/CD deployment, a script can query an endpoint, such as /v1/projects/payment-service/slos/latency/status, to get the current SLO status:
{
"slo": "payment-latency",
"project": "payment-service",
"status": {
"error_budget_remaining_percentage": 14.5,
"current_burn_rate": 2.4,
"budget_depleted": false
}
}
Then, based on the error_budget_remaining_percentage value, if the remaining budget falls below the safety margin, the script can trigger an automated exit logic to halt the deployment and alert the team.
SLO platforms like Nobl9 provide access to these endpoints through a REST API, the sloctl CLI, and a model context protocol (MCP) server. The MCP server integration allows AI agents and automated workflows to securely query project health, perform configuration audits, and modify thresholds directly through code.
Establishing shared reliability standards
Storing SLO definitions alongside application source code assures programmatic compliance during pull requests and provides more than just generic team alignment.
When a team member adds a new API route or modifies a database dependency, they update the corresponding SLO file in the same commit. This enables the continuous integration pipeline to automatically validate the metric syntax against the live monitoring backend before merging.
This code-centric approach simplifies integrating agentic workflows into release cycles. As targets are structured text files, automated AI agents can validate and suggest updates to reliability definitions.
For example, if an untracked API route is merged, an autonomous agent can scan the repository, use existing templates to generate a missing SLO configuration block, and automatically open a pull request.
Similarly, agents can analyze historical burn rates and programmatically adjust target thresholds to reduce alert fatigue, keeping reliability margins optimized.
Try our SLO Implementation ROI Calculator
Try ROI CalculatorTechnical math in SLO calculations
Standard statistical averages can obscure important performance spikes when analyzing thousands of events per second. Accurate system health evaluation requires precise aggregation of telemetry data and careful application of time-weighting methods.
This section explains the mathematics behind SLO calculations and compares how different data structures and evaluation windows reveal or conceal users’ actual experiences.
Using histograms for high-precision latency
Averages and aggregated percentiles can obscure short-term performance spikes by smoothing out sharp data points caused by outliers.
For example, if a system handles 10,000 requests with 9,900 completing in 10 milliseconds and 100 taking 5 seconds, a client-side average or pre-aggregated percentile may conceal that 1% of users faced significant delays.
To preserve data granularity, log-linear histograms route individual requests into exponentially spaced latency buckets during ingestion.
To understand how histograms track latency, picture a row of sorting bins.
- Linear spacing means every bin is exactly the same width (e.g., 0–10ms, 10–20ms, 20–30ms, 30–40ms).
- Exponential spacing means each bin gets progressively wider than the one before it by multiplying the boundaries by a fixed factor (e.g., 0–10ms, 10–20ms, 20–40ms, 40–80ms, 80–160ms).
Why use an inverse percentile?
To extract meaning from your telemetry data, look at the calculation in two ways.
A standard percentile query uses a target percentage, such as 99%, and scans the histogram buckets from left to right to find the latency boundary that matches the target.
For example, the query below asks: “What is the maximum latency experienced by 99% of our users?”
histogram_quantile(0.99, sum(rate(http_request_duration_seconds_bucket{job="checkout"}[5m])) by (le))
Here, you pass the target percentage as a decimal (0.99) into the histogram_quantile function. The engine aggregates all the tracking buckets across your nodes, scans them from lowest to highest to locate the bucket where the 99th percentile falls, and returns an estimated duration value.
An inverse percentile query takes a fixed latency boundary, such as 200ms, and the engine sums the counters below that threshold to calculate the matching compliance percentage. This shows the exact number of affected users across your environment without flattening your telemetry data.
For instance, the query below flips the question: “What exact percentage of our traffic completed within our 200ms threshold?”
sum(rate(http_request_duration_seconds_bucket{le="0.2", job="checkout"}[5m]))
/
sum(rate(http_request_duration_seconds_count{job="checkout"}[5m]))
Here, you pass a fixed latency boundary using the le (less-than-or-equal-to) label filter set to your target threshold (0.2 seconds). The query explicitly sums the request rates of all compliant buckets and divides that by the total request count metric, returning an exact compliance percentage.
Request occurrences vs. Time slices
When defining an SLO, you need to decide whether to measure performance failures by individual requests (occurrences) or by fixed time intervals (time slices).
Selecting the wrong method may allow high daytime traffic to flatten critical outages.
1. Request occurrences (Volume-weighted)The occurrence method evaluates each request independently. For example, if your system processes 100,000 requests daily and 99,000 succeed, the compliance rate is 99%.
However, high-volume peak traffic can mask outages that occur during off-peak hours.
For example, if your service operates normally during high-traffic periods but experiences a 30-minute outage at 3 am, when traffic is low, the small number of failed overnight requests is insignificant compared to daytime volume. The occurrence model may therefore indicate strong performance even though the platform was unavailable for 30 minutes.
-1.png?width=1200&height=861&name=Occurrences%20engine%20(Evaluation%20Total%20good%20requests%20%20Total%20requests)-1.png)
Occurrences engine (Evaluation: Total good requests / Total requests)
2. Time slices (Time-weighted)
The time-slice method divides the monitoring period into uniform intervals, typically one minute each, and evaluates compliance with each interval.
Each interval is marked as good or bad based on whether it meets the latency standard. Since all intervals are weighted equally, an outage at 3 am counts the same as the one at 3 pm in your error budget.
This way ensures off-peak stability is measured as the same as peak performance, making it suitable for low-traffic services or crucial processes.
.png?width=1000&height=1064&name=Time%20slice%20engine%20(Evaluation%20Compliant%20minutes%20%20Total%20minutes).png)
Time slice engine (Evaluation: Compliant minutes / Total minutes)
With Nobl9 Integration, you can use SLO backtesting to ingest historical data from your monitoring tools before enabling live alerts. This lets you simulate both occurrence and time-slice models against past incidents, helping you determine which approach best identifies regressions before applying them to your error budgets.
Visit SLOcademy, our free SLO learning center
Visit SLOcademy. No Form.Managing SLO governance
Software configurations and service boundaries develop over time, which can cause SLOs to become misaligned with the current environment if not monitored. This drift results in unowned tracking parameters, outdated alerts, and inaccurate telemetry thresholds. To prevent these issues, programmatic governance roles should be integrated into the configuration lifecycle.
This section explains how validation rules address accountability gaps and how lifecycle tracking identifies stale configurations.
Service ownership and accountability debt
Microservices are frequently modified or reassigned across engineering teams during development cycles. Over time, these changes create orphaned SLOs. When this happens, no active team monitors the associated error budgets or receives the alert payloads.
SLO platforms such as Nobl9 address this accountability gap through SLO oversight features. Oversight enforces validation checks on ownership parameters at the service definition level, requiring each new or modified service entry to map to an active team identifier. This ensures SLO configurations inherit these fields and maintain a continuous notification path.
For example, the governance engine evaluates the metadata fields of every service definition against a structural validation rule:
If: service_owner == null
Or: assigned_team_active == false
Then: status = "OWNERSHIP_DEBT" -> restrict_alert_routing
Applying this rule changes how the platform handles alerts. When a service meets these conditions, it is marked as ownership debt in the central status view, and alert routing to inactive or missing destinations is restricted. Notifications are paused until a team member updates the ownership attributes, after which alert dispatching resumes.
Overdue SLO verification
Latency baselines and availability targets become less accurate as application traffic patterns change. Targets set in previous quarters may cause false alert spikes or conceal current system errors if not re-evaluated.
SLO oversight resolves this by scanning active configurations to isolate records that lack recent validation. The tool calculates the age of the threshold rules since their last manual or programmatic approval, grouping stale configurations into overdue SLO metrics that have passed their check-in date and dusty metrics that have reached a fixed six-month window without updates.
The platform monitors the configuration lifecycle by tracking the timestamp of the last administrative modification or manual sign-off. It calculates the age as follows:
If: days_since_last_review > 180
Then: status = "DUSTY" -> dispatch_channel_notification
When an SLO age exceeds 180 days, the platform flags the target status as dusty. It automatically sends a data payload to the owner’s communication channel and limits reporting views for that metric block. The status is resolved once a reviewer updates the target values or confirms that the existing threshold remains correct.
Learn how 300 surveyed enterprises use SLOs
Download ReportSLO-driven automated workflows
Structuring telemetry data with log-linear histograms and analyzing it with appropriate models lets these metrics support more than just passive monitoring. The next step is to adapt an automated operations model, which converts the live error budget into a real-time API parameter to directly control infrastructure behavior.
This section describes how automated pipelines use real-time budget data to halt unstable deployments via safety gates, optimize resource allocation through data-driven rightsizing, and route on-call notifications via automated burn-rate alert triage.
Deployment safety gates
Continuous integration and deployment pipelines that depend on manual approvals or static validation windows may release broken code to all users before you can intervene.
SLO software addresses this by providing query APIs that deployment tools poll during rollouts. Treating the error budget as a live parameter enables automated validation of code stability against production traffic.
To understand this practically, consider the workflow below:
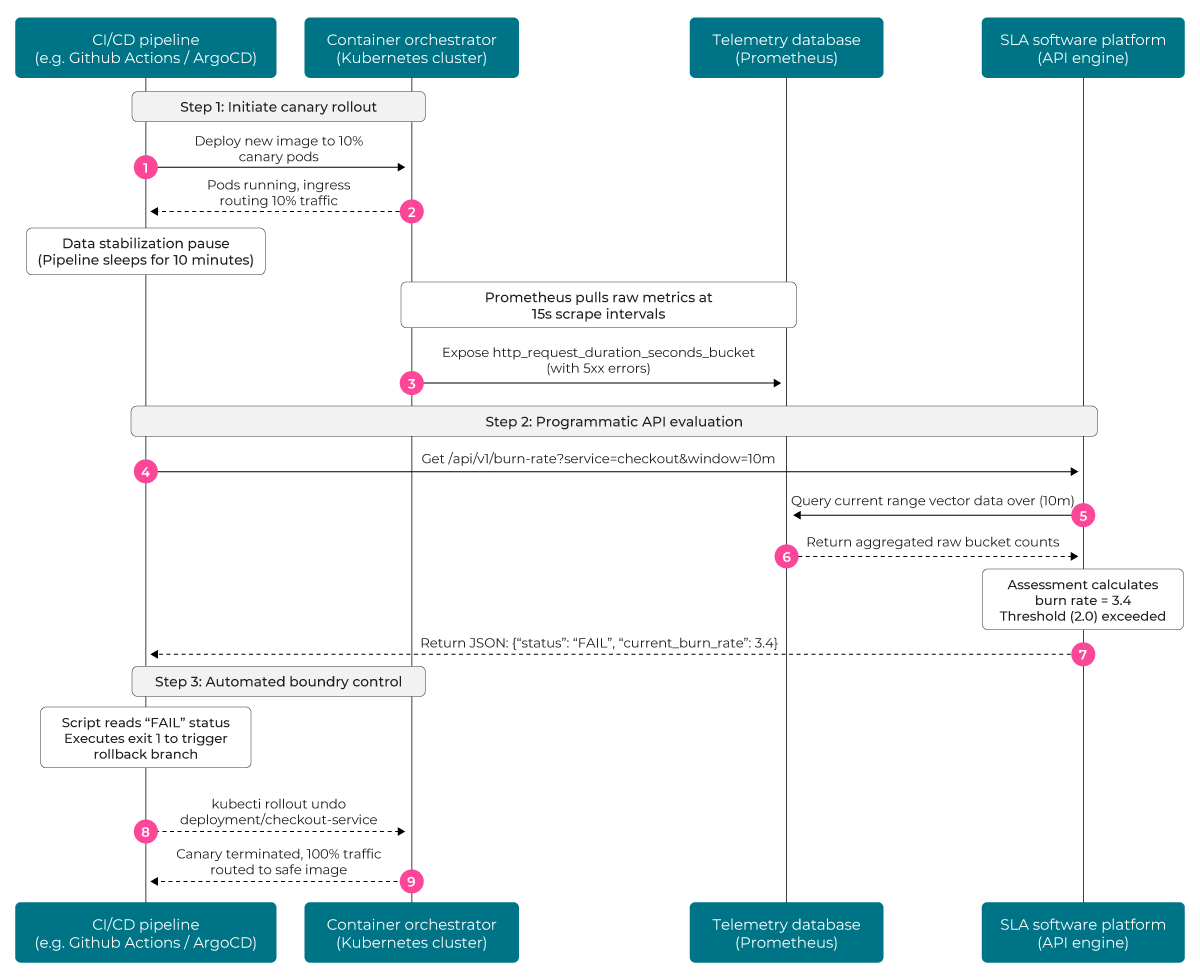
Logical diagram of a CI/CD pipeline integrated with SLO software APIs.
Here, a continuous delivery pipeline deploys a new container version to a 10% canary instance and pauses briefly. This pause allows the monitoring tool to complete several scrape cycles, ensuring the PromQL range vector contains only traffic from the new build.
An orchestration script then queries the SLO software API to evaluate the canary’s performance against a budget consumption threshold. If the burn rate over, let’s say, a 10-minute window exceeds base margins, an automatic rollback is triggered.
If the canary generates unexpected 5xx errors that increase the burn rate above the threshold, the pipeline immediately rolls back the release to prevent impact on the remaining 90% of user traffic.
Data-backed infrastructure rightsizing
Cloud infrastructure is often over-provisioned to handle unpredictable traffic spikes. Without a way to align resource limits with service stability, teams underutilize compute capacity, increasing operational costs.
SLO software solves this by linking infrastructure utilization metrics with long-term user compliance trends. It provides historical data to reduce resource overhead and determine the minimum headroom required for service stability.
As before, consider the following scenario:
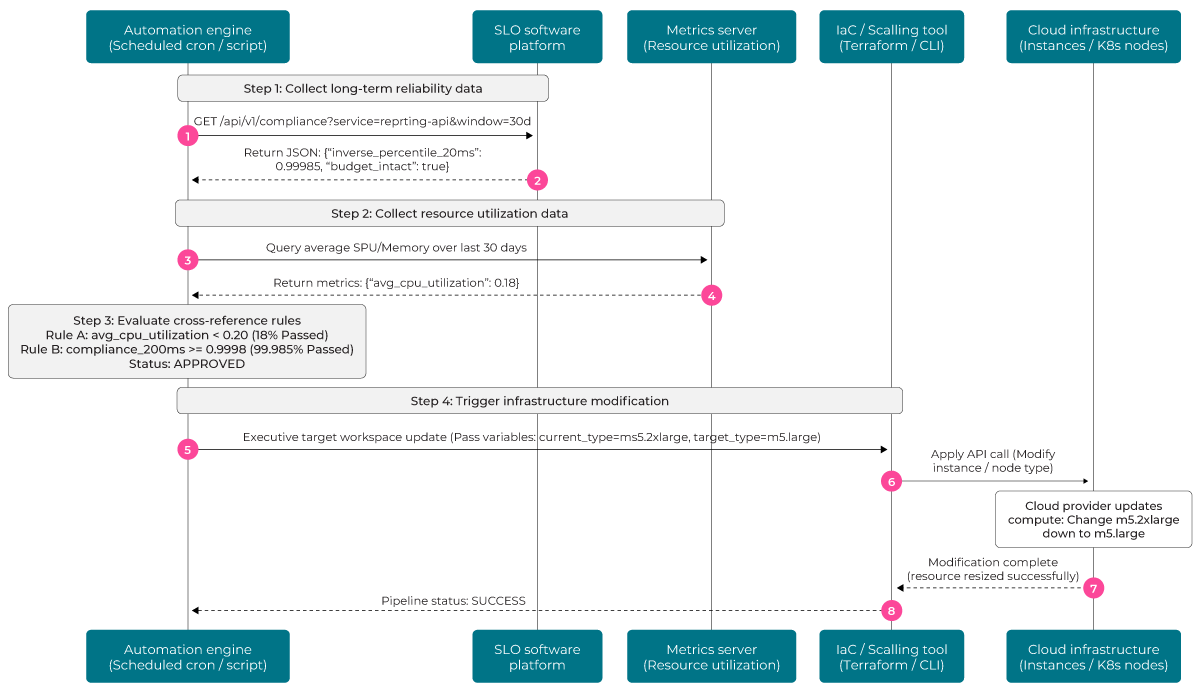
Logical diagram of an integration between infrastructure services and an SLO software platform.
Automation scripts query the SLO platform to compare a service’s 30-day compliance trends with its latency standard.
The infrastructure engine cross-references resource overhead with budget health. It approves a resource downgrade only if average resource utilization is below 20% and the inverse percentile calculation for a 200ms threshold shows that at least 99.98% of traffic is compliant, preserving the error budget.
Then a scheduled Terraform or auto-scaling action adjusts instance types, such as downsizing from m5.2xlarge to m5.large.
This approach reduces compute costs by ensuring performance stays within user requirements using reliability margins.
Burn rate alert triage
Static alert thresholds often trigger alerts for brief spikes, leading to on-call fatigue. In contrast, slow error leaks may go unnoticed until the monthly error budget is depleted.
SLO platform addresses this issue by using multi-window, multi-burn rate alerting. The platform calculates error budget consumption rates and categorizes incidents by time to exhaustion.
To execute this, the alerting engine evaluates live telemetry across both short-term and long-term rolling windows. It calculates the consumption rate to determine if a spike requires immediate intervention or can be routed to the backlog.
For example, if a critical failure causes rapid error budget consumption, such as a 4x burn rate over 1 hour, the platform identifies it as an immediate emergency. It routes the alert to high-priority channels.
Conversely, a minor bug may cause a slow increase in error budget consumption, such as a 1.05x burn rate over six hours. Since this poses no immediate risk, the platform suppresses pager alerts. Instead, it creates a low-priority ticket for scheduled maintenance during business hours.
This approach helps on-call engineers reduce alert fatigue.
Conclusion
To scale microservice architectures, move from manual dashboard-based monitoring to managed automated SLOs. Manual correlation of data streams during incidents causes unacceptable operational delays. Consolidating metrics, logs, and traces on a unified platform addresses these challenges by reducing technical debt, streamlining debugging, and mitigating vendor lock-in.
A centralized SLO platform changes reliability from a standalone metric into a programmatic object you can manage as code. Treating objectives as version-controlled configurations lets you create repeatable deployment safety gates, enforce strict lifecycle governance, and implement closed-loop automation.
Ultimately, leveraging SLO software for real-time error budgeting helps you balance fast feature deployment, consistent user experience, and cloud infrastructure costs
Navigate Chapters: