
-1.png)

Table of Contents
Like this article?
Subscribe to our Linkedin Newsletter to receive more educational content
Subscribe nowCustomer-Facing Reliability Powered by Service-Level Objectives
Service Availability Powered by Service-Level Objectives
Learn More
Integrate with your existing monitoring tools to create simple and composite SLOs

Rely on patented algorithms to calculate accurate and trustworthy SLOs

Fast forward historical data to define accurate SLOs and SLIs in minutes
Understanding error budgets
An error budget is a concrete metric showing the amount of acceptable downtime or failure a service can tolerate before breaching its SLO. It translates reliability targets into tangible limits, delineating how much “room for error” exists before user dissatisfaction or violation of service-level agreements (SLAs). For instance, with a 99.9% availability target, a 0.1% error budget indicates approximately 43 minutes of allowable monthly downtime. Practical application can be illustrated using Nobl9’s SLO error budget documentation.
The table below shows some examples that will be further expanded on in this section.
|
Service / Component |
SLO Target |
Time window |
Error budget (allowed downtime) |
|
Checkout API (critical path) |
99.9% Availability |
30-day rolling |
0.1% = 43 minutes / 30 days |
|
Image-resize worker (supporting job, non-critical) |
99.5% availability |
Calendar month |
0.5% = 3 hours and 39 minutes per month |
To choose appropriate targets, use historical availability and business-impact data to pick a reliability value that’s ambitious, yet realistic. In the SLODLC template, one idea is to capture, for example, why you would choose an SLO like 99.9% for Checkout API but a lower 99.5% for the image worker; e.g., “checkout failure costs lost revenue; image lag only delays thumbnails.” Documenting that rationale keeps any future changes grounded in data.
SLO dependencies
Service-level indicators (SLIs) track specific performance metrics, like how quickly requests get processed. SLOs set goals for those metrics over a given period of time, such as ensuring that 99% of requests finish in less than 200 milliseconds each month. The error budget shows how much you can miss these targets before it becomes a problem. Clearly laying out these relationships in a structured template helps everyone involved understand exactly what’s expected and what’s acceptable.
|
Field in SLI/SLO Template |
Example Service: Checkout Latency |
|
SLI Name |
checkout_error_rate |
|
Metric / Query |
rate(checkout_requests_error_count{route="/checkout"}) / rate(checkout_requests_total_count{route="/checkout"}) |
|
SLO Target |
< 1% error rate |
|
Time Window |
Rolling 28 days |
|
Derived Error Budget |
1% of requests may be errors (6h 43m / 28 days) |
For architectures built from many independent services, you can combine several individual SLOs into a composite SLO: one roll-up objective whose error budgets reflect the reliability of the entire user journey.
Practical calculation method
Calculating an error budget is straightforward. It's first set as a percentage from your service-level objective (SLO), then often converted to absolute terms (like downtime minutes or failed request counts) for practical use.
Error budget as a percentage
This is calculated simply as the inverse of the SLO target:
Error Budget % = (100% - SLO Target %)
Example: If your SLO is a success target (e.g., 99.9% availability), your error budget = 100% - 99.9% = 0.1%.
Converting percentage error budgets to absolute time figures
Absolute numbers make the budget more concrete for day-to-day management. To find the allowable downtime, multiply your error budget in percentage by the SLO window's total duration. Ensure that you use consistent units, like minutes, for both:
Absolute Error Budget (time) = Error Budget (%) x Total Duration of SLO Window
Example: A service has a 99.95% monthly availability SLO over 30 days.
- Error budget (%) = 100% - 99.95% = 0.05%
- SLO window = 30 days × 24 hr/day × 60 min/hr = 43,200 minutes
- Absolute error budget (time) = 0.05% × 43,200 min = 0.0005 × 43,200 = 21.6 minutes/month
Converting percentage error budgets to absolute count figures
This is done in a way similar to how it is for time. To find the number of permissible failed requests, multiply your error budget percentage by the total expected events in the SLO window.
Absolute Error Budget (count) = Error Budget (%) x Total Expected Events in SLO Window
Example: An SLO allows for no more than 1 error per 10,000 requests. The service handles 1,000,000 requests in the SLO window.
- Error budget (%) = (1 error / 10,000 requests) × 100% = 0.01%
- Absolute error budget (count) = 0.01% × 1,000,000 requests = 0.0001 × 1,000,000 = 100 failed requests
Understanding both percentage and absolute error budgets can be key for managing service reliability. Nobl9 outlines the calculation of error budgets in more depth here.
Burn rate
The burn rate quantifies how quickly an error budget is consumed and how urgent a response should be. What consumes the budget?
Every request that violates the SLO (e.g., an HTTP 5xx, a latency > 300ms, a missed heartbeat) subtracts from the allowance.
How to measure it:
Burn Rate = Current Error Rate / Allowed Error Rate
“Current error rate” is the ratio of violations to total requests over the same window that the SLO uses.
For example, if a service’s allowable error rate (error budget) is 0.1% (1 error per 1,000 requests), but it currently experiences an error rate of 0.3% (3 errors per 1,000 requests), the burn rate is 3×. A burn rate exceeding 1 by a fair bit signals rapid budget depletion, in most cases requiring immediate intervention. Visual examples from Nobl9’s documentation can illustrate different scenarios clearly.
We will visit typical responses to varying burn rates in a later section, but the table below provides a simple framework.
|
Burn Rate |
Meaning |
Possible Responses |
|
< 1x |
The budget is burning slower than it accrues |
Normal releases proceed |
|
> 1x |
The budget will run out before the window ends. The higher the rate, the more severe the use case. |
Investigate top errors at 1x - 3x. Freeze releases at over 3x. |
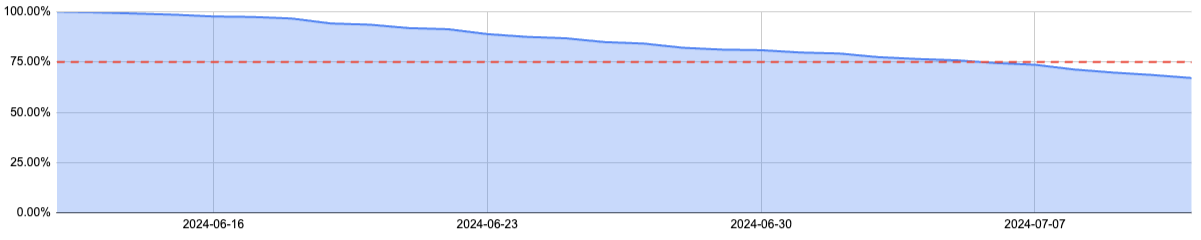
The chart below illustrates that the entire budget has been consumed (or “burned down”) when reliability falls below the target. Reliability below the 75% target is not acceptable.
Customer-Facing Reliability Powered by Service-Level Objectives
Service Availability Powered by Service-Level Objectives
Learn More
Time windows
Error budget math is only meaningful when you define when the clock starts and stops. Per the SLODLC template, there are two factors: window type (rolling/calendar) and window length. These variables control how “allowed downtime” is calculated and reset.
Rolling (sliding) window
In this approach, the budget is recalculated over the last N days/minutes at every evaluation. Violations age out gradually.
Example: A streaming platform has a 28-day window and a 99.95% availability target, which yields a 21.6 minute error budget. A spike on May 1st burns 15 minutes. By May 29, that spike has rolled out of the window and the budget is restored to 21.6 minutes, so no manual reset is needed.
Calendar-aligned window
In this method, the budget counter resets to full at a fixed time (e.g., midnight on the first of every month).
Example: A fintech app has a monthly window and a 99.9% availability SLO, which means 43 minutes of budget each calendar month. If 40 minutes are burned on Apr 30, the gauge is almost empty, but on May 1 at 00:00, the budget fully refills to 43 minutes.
Comparing the approaches
In practical terms, a rolling window rewards quick fixes: as soon as an incident ages out of the look-back period, the consumed budget slowly returns, which nudges teams toward continuous improvement. By contrast, a calendar-aligned window instead resets the budget at a fixed boundary, so teams often freeze releases near month-end to avoid starting the new period “in the red.”
Here are some use cases regarding when to use which type of window:
- For responsiveness and continuous improvement, rolling windows are preferable. They allow teams to very quickly detect and react to performance degradation as incidents “roll out” of the window and the budget recovers. This encourages a focus on rapid fixes and ongoing reliability improvements. For example, a streaming platform would benefit from a rolling window to address quality issues as they arise.
- For reporting and planning: Calendar-aligned windows simplify reporting and align well with business cycles. They provide clear monthly (or quarterly) error budgets, making it easier to evaluate overall reliability and plan infrastructure investments. However, be aware that a single incident at the start of the window can consume the entire budget, and the team will have to wait until the next window to recover. For instance, financial applications often use calendar-aligned windows for monthly performance reports.
Evaluate which window type best supports your error budget management strategy using resources like Nobl9’s guide to time windows, which walks through additional use cases.
Proactive notification
Effective alerting is an important part of proactively managing error budgets. Alerts should trigger before critical depletion, allowing teams to respond to potential reliability issues.
The key to effective alerting is defining clear thresholds for both the remaining error budget and the burn rate:
- Remaining error budget thresholds: The common practice supported by SLODLC is to trigger a warning at around 25% remaining and a critical alert at around 10%.
- Burn rate thresholds: Alerts trigger when the current burn rate significantly exceeds the expected rate. The SLODLC recommends alerting above 2× the expected rate. Consider short-window alerts (e.g., 5 minutes) for spikes and long windows (1 hour or 1 day) for trends.
Multi-window, multi-burn-rate alerts provide nuanced responses. For example, you might trigger a warning if the 1-hour burn rate exceeds 2× or the budget falls below 25%, and a critical alert if the 5-minute burn rate exceeds 5× or the budget falls below 10%.
Effective alerting systems, such as Nobl9’s, should provide the ability to do all of the following.
|
Capability |
Description |
|
Configurable thresholds |
Set and adjust thresholds for budget and burn rate. |
|
Multiple time windows |
Support various time windows (e.g., 5 minutes, 1 hour, 1 day) |
|
Severity levels |
Define alert levels (e.g., warning, critical) |
|
Audience targeting |
Target alerting systems to target various support or management groups for different escalation scenarios |
|
Multi-channel notification |
Route alerts and notifications over multiple channels (email, Slack, PagerDuty, etc.) for different levels of severity and frequency |
Best practices for implementing error budgets
Let’s look at error budget best practices and outline how to integrate these principles effectively into your operational workflow.
Leverage user-focused SLOs
Error budgets are most effective when tied to user-focused SLOs, which directly impact user experience and business outcomes. This approach ensures that reliability efforts are aligned with what truly matters to users and the business. Defining these SLOs requires consideration of key user journeys and their associated metrics. For example, an online retailer might define an SLO as: “99.9% of checkout transactions must be completed within 2 seconds.”
Here’s how to approach user-focused SLOs:
- Identify critical user journeys: Map out the most important user interactions with the service (e.g., checkout processes, search functionality, content loading).
- Define key metrics: Determine the metrics that best reflect the user experience for each journey (such as latency, error rate, or availability).
- Set realistic targets: Establish SLO targets that aim to balance user expectations with technical feasibility. This may involve analyzing historical performance data, considering higher-level benchmarks, and aligning with business goals.
Considering the checkout example above, the 99.9% target might be chosen because it represents the level of reliability needed to maintain customer satisfaction and minimize cart abandonment. The two-second threshold might be based on research showing the impact of latency on conversion rates.
Guide feature releases with error budgets
Error budgets can be used as a tool for guiding decisions about feature releases and reliability investments. They provide a data-driven approach to balancing innovation vs stability.
When a service is consistently operating within its error budget, the current reliability level meets expectations. In this case, teams can accelerate feature deployments. This doesn't always mean a full “go-ahead” for every release but can allow for more frequent or riskier deployments. For example, teams might:
- Increase the frequency of smaller or incremental releases.
- Introduce new features to less critical parts of the system for initial testing.
When the error budget is being rapidly consumed, or it is depleted altogether, this is a signal to focus on reliability. In this case, teams should pause or slow down feature rollouts and focus on improving the system's stability. For example, if recent deployments have caused increased latency or errors, the team might:
- Pause or postpone non-essential feature releases.
- Dedicate resources to address the underlying reliability issues, such as infrastructure enhancements or bug fixes.
Use composite error budgets
Modern user journeys rarely touch a single microservice; they traverse chains of APIs, queues, databases, and third-party platforms. Although every component should have its own SLO, day-to-day decisions are easier when you can glance at one budget that represents the reliability of the higher-level user experience.
Composite SLOs provide this “roll-up” view by combining the error budgets of individual (“child”) SLOs into a single metric. Most tools, including solutions like Nobl9's Composite SLOs, allow you to:
- Pull SLOs from various data sources.
- Apply business-impact weights to different services.
- Calculate a unified burn rate for the composite SLO.
For example, consider an e-commerce platform. The “add to cart” user journey might involve several services: a product catalog API, an inventory service, and a shopping cart database. A composite SLO could combine the individual SLOs of these services to provide an overall picture of the reliability of the functionality.
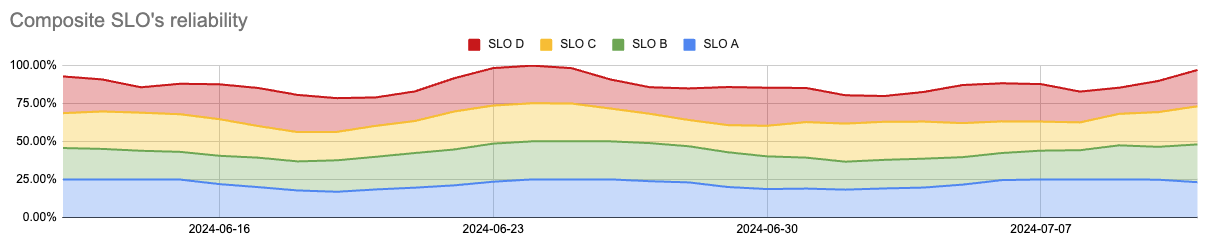
Composite reliability sample (source)
A composite budget provides several benefits:
- It indicates overall customer impact by answering the question: “Are we still in the green overall?”
- It lets you weight journeys based on business importance, so critical user journeys consume more of the shared budget than non-critical paths.
- It provides a clear triage target. When the composite SLO slips, the fastest burning component is typically the first place to investigate.
Composites matter because they offer one red/green signal for leaders, point SREs straight to the top error budget burner, and let teams ship lower-impact features while critical user journeys recover. Nobl9 recommends using composite SLOs to effectively manage reliability in complex, distributed systems, enabling teams to quickly understand overall system health and prioritize their efforts.
Tip: The SLODLC advises setting all child SLOs to the same time window, initially assigning them equal weights, and configuring alerts to trigger when the composite SLO's burn rate exceeds 2x for an hour or when the remaining budget drops below 10%. This provides a solid foundation for monitoring and responding to issues in complex systems.
Integrate error budgets into incident response
Integrating error budget tracking into your incident management process enables a proactive and data-driven approach to maintaining reliability. Rather than simply reacting to incidents, teams can use error budgets to make informed decisions about incident response and prevention. For example, automated systems can trigger escalations or rollbacks if an incident rapidly consumes the error budget, ensuring a quick response to protect reliability.
Incident post-mortems should include a thorough review of the incident's impact on the error budget. These insights can then be used to prioritize remediation tasks and prevent similar incidents in the future.
The table below shows a recommendation for how to structure responses based on thresholds.
|
Threshold |
Error Budget |
Action |
|
1 |
1-day error budget is exhausted |
Automated alerts notify SRE of an at-risk SLO. |
|
2 |
7-day error budget is exhausted |
SRE concludes that they need help to defend SLO and escalate to devs. |
|
3 |
30-day error budget is exhausted |
The root cause has not been found; SRE blocks releases and asks for dev support. |
|
4 |
90-day error budget is exhausted |
The root cause has still not been found; SRE escalates to executive leadership. |
Integrating error budget data into your existing incident response can ensure faster fixes and more informed reliability planning. Tools such as the SLODLC handbook provide helpful guidance on responding based on an error budget alert’s severity.
Refine your SLOs
Once error budgets are operational, two common patterns suggest your SLOs need refinement:
When the error budget is never consumed:Your SLO may be too conservative if a service consistently operates with a full error budget. An overly loose SLO can mask subtle performance issues and fail to guide decisions on innovation vs. stability. Consider tightening the SLO (e.g., from 99.9% to 99.95%) to better reflect an ambitious but realistic reliability target. This recalibration can better help teams ship features confidently with a meaningful guardrail against user-facing impact.
When the error budget is always red but no issues are found:
Conversely, an error budget constantly depleted without corresponding user complaints often leads to alert fatigue. This usually means the SLI is flawed and doesn’t represent the user experience, or the SLO target is too aggressive. First, investigate the SLI to ensure it tracks a meaningful metric. If it does, re-evaluate the SLO target with stakeholders to align it with genuine user impact. Adjusting the target restores trust in your alerting and makes the error budget a more effective operational tool.
Navigate Chapters: