

Table of Contents

MTTR (mean time to recovery, a.k.a. mean time to repair) is a metric that measures the average time required to diagnose, repair, and fully restore a failed system or service back to normal operation following an outage or incident. It is commonly used in incident response, yet it does little to help engineers improve system reliability, as traditional MTTR evaluates incidents only after they occur and fails to provide teams with real-time, actionable insights for implementing proactive solutions.

SLOs (Service Level Objectives) provide engineers with a more proactive, continuous signal to manage reliability before issues become incidents. SLOs track real-time performance against reliability targets that reflect the customer experience; this performance gauge then steers developer efforts between new features and reliability improvements.

In this article, we examine the key features of MTTR software and discuss why using SLOs as a key ingredient in your MTTR measurements is essential for modern engineering teams.

NEW: Watch how you can use AI to Discover which SLIs to measure

Watch 3-min Video. No forms.

Summary of key features of MTTR software

The table below summarizes six key MTTR software features this article explores in more detail.

Feature

Description

Automated MTTR calculation

Computes MTTR and related metrics (MTTD, MTTA, MTTR, and MTBF) directly from the tools that saw the incident, not hand-edited ticket fields

Incident timelines and dashboards

Accurately reconstructs and reports the series of events as they happened during each incident with visual timelines and dashboards

Distribution-aware reporting

Reporting that includes percentiles and per-incident views ensures that means (averages) don’t hide the outages that matter most

User-centric SLIs & SLOs

SLIs, SLOs, and Composite SLOs measure and report what the user actually experienced across the entire user journey without waiting for an incident to occur

SLO error budgets

Quantifies the tolerable drop in reliability and, with burn rate alerting for error budgets, turns reliability into a live signal that fires before and during the incident, not just after

Backtesting and SLOs-as-code

Sets realistic reliability targets from real, historical data and keeps targets versioned in code and reviewable

Automated MTTR calculation

MTTR software describes software that measures and reports the Mean Time to Recovery and other related ’mean time’ metrics.

Other ‘mean time’ metrics in this category are often defined as follows:

Metric

Name

Clock starts

Clock stops

MTTD

Mean time to detect

Failure begins to affect the system

Monitoring raises an alert

MTTA

Mean time to acknowledge

Alert fires

A responder takes ownership

MTTR

Mean time to recovery

Failure begins

Service restored for users

MTBF

Mean time between failures

Recovery from one failure

Onset of the next distinct failure

These metrics are all related segments of a single timeline, beginning with system failure and ending with problem resolution and service restoration. Their objective is to measure the overlapping processes of detection, response, repair, recovery, and resolution.mttr-visual
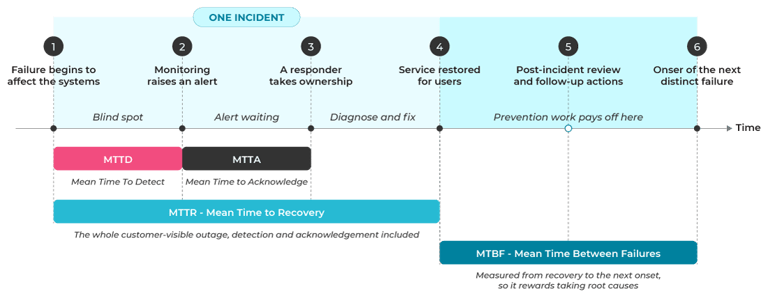
Visual representation of MTTx metrics on the incident timeline. Each horizontal bar below the line shows the exact span of the timeline that the metric measures.

These metrics, although very common in incident management, contain inherent flaws.

The most obvious deficiencies can be summarized as follows:

The metrics are susceptible to gaming and misreporting.

When you measure and report MTTR, you inadvertently incentivize early ticket closure or quick fixes to declare recovery. The metric itself cannot distinguish these remedies and often misreports the true nature of remediation. A telling sign of this antipattern is when a related incident happens shortly afterward.

The metrics are subjective.

Determining when partial degradation began or when service was restored is a matter of judgment and open to interpretation. The highly ambiguous nature of these metrics and the fluid nature of the incident response process mean different individuals will draw different conclusions.

The metrics are frequently estimated and populated manually.

Incident reporting and auditing usually happen after the fact as part of post-incident activity, often using manually-populated data. This is typically done by the team being judged on their own performance, so manually curated timelines encourage the use of figures that “look good”.

So, given these obvious flaws, the first thing we look for in software measuring MTTR is that the data the metrics are derived from comes directly from the monitoring stack.

Integration with the underlying monitoring stack addresses all three deficiencies, which is why it’s the first step in any evaluation. Detection time should come from the monitoring system that raised the alert, acknowledgment from the paging tool, and recovery from the measured signal confirming the service was restored, rather than from a field completed by hand in a ticket.

Closely examine which of your monitoring, paging, and deployment tools the product ingests natively, whether each phase timestamp is derived or editable, and whether a manual amendment leaves an audit trail.

The key insight here is that automated collection of the metrics may not make the metrics meaningful. But it at least keeps them honest, which is a precondition for evaluating their usefulness.

Customer-Facing Reliability Powered by Service-Level Objectives

Service Availability Powered by Service-Level Objectives

Learn More

Integrate with your existing monitoring tools to create simple and composite SLOs

Rely on patented algorithms to calculate accurate and trustworthy SLOs

Fast forward historical data to define accurate SLOs and SLIs in minutes

Incident timelines and dashboards

Timeline reconstruction assembles all alerts, deployments, status transitions, and human actions into a single chronology. This lets the post-incident review proceed from a shared record rather than competing recollections. It also enables accurate, fact-based incident timelines and trend dashboards.

Charts, as shown in the example dashboard below, help visualize the incident development over time. Severity segmentation of unique incidents also helps separate routine noise from major events. This separation is important because trend lines that combine the two measure ticket volume more than reliability.
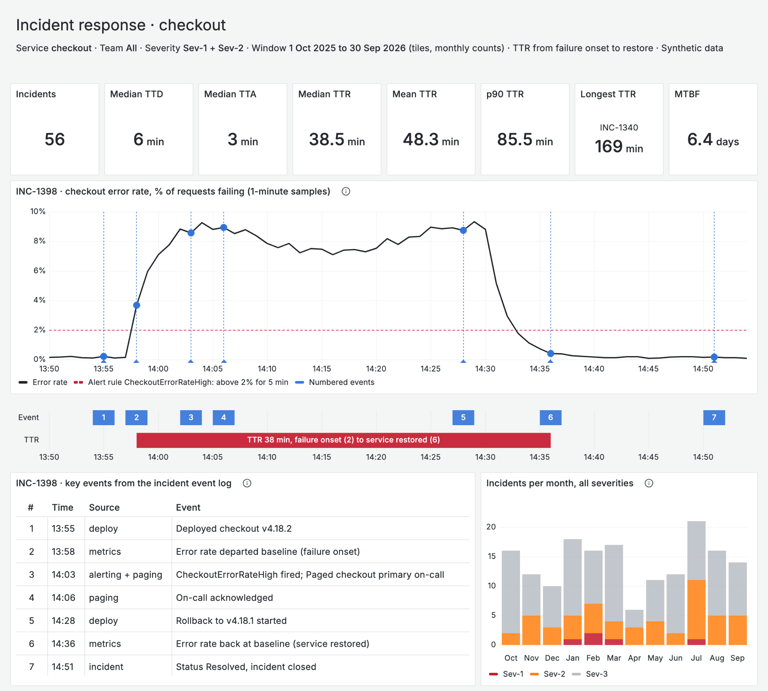
mttr-incident-response

Example illustration of how an MTTR dashboard could convey incident development over time

In this context, mean-time reporting has legitimate applications that are worth stating:

Executive reporting

A statement that service has been restored communicates clearly to a non-technical audience that does not read dashboards, in a way that more technical measurements do not.

Post-incident SLA communication

Contractual discussions usually focus on durations and service credits, and a defensible timeline substantiates them.

Preservation of history

An immutable timeline maintains a historical record for comparison and ensures that a post-incident review is a learning exercise rather than a negotiation. It also exposes any material changes in the phases being measured and response time.

So, when evaluating MTTR software, confirm whether the timeline is assembled automatically from source events, whether trends can be segmented by service, team, and severity, and whether closed incidents are immutable.

Timeline and trend reporting is another minimum evaluation requirement. It accurately answers the question of what the team did. However, it cannot answer the question of what users experienced.

Distribution-aware reporting

MTTR software that can perform distribution-aware reporting satisfies another important requirement.

Incident duration is not normally distributed. That is, most duration values do not cluster around a central average and taper off equally on either side of that average. Instead, it is much more likely to have many short outages combined with a small number of more severe, protracted outages.

So, reporting the mean in the presence of outliers or extreme values strongly distorts the overall picture. With many short outages and a few lengthy ones, the mean can significantly misrepresent the overall state of incident response and recovery.

Given how common skewed distributions are, software that treats this seriously reports the actual distribution rather than simply the mean:

Median, 90th percentile, and the worst incident for the period

The median establishes what a typical incident costs the organization. Meanwhile, the 90th percentile and the worst case establish what occurs when an incident goes badly, which is the worst-case scenario question that leadership actually wants to know.

Per-incident views and duration histograms

Each incident is reported on its own terms, and a distribution across two quarters conveys a more accurate account than a trend line of means.
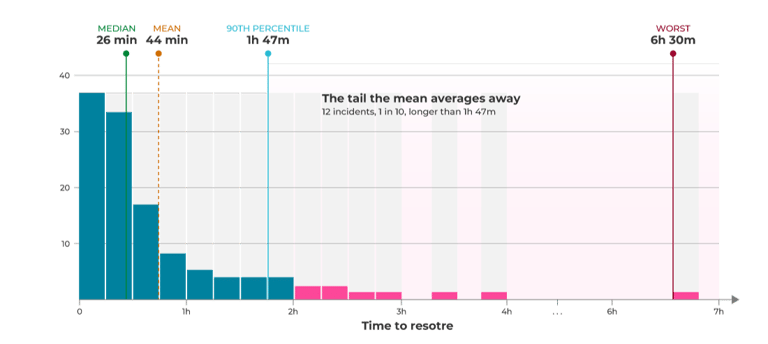
mttr-incident-histogram

Example showing how incident durations are right-skewed. 71% of the incidents are shorter than the mean, and removing the 6h 30m outage shifts the mean by 3 minutes. Report the full distribution instead.

So, establish whether the product can chart percentiles and duration histograms at all, or whether every reliability view it offers is a simple mean over a given period.

A product that can only chart the average will conceal the outage that really hurt the business. The best way to convey the incident history is to show the full distribution, especially when the sample size is small. The full distribution represents reliability far better than a single figure, such as the mean.

Customer-Facing Reliability Powered by Service-Level Objectives

Service Availability Powered by Service-Level Objectives

Learn More

User-centric SLIs & SLOs

The features above all address a backward-looking question: how quickly engineers reacted to a new service disruption and how quickly they remedied it. This is where most MTTR software stops. The limitations of this model are obvious: it is inherently reactive and single-issue focused.

Maintaining reliability, however, is a continuous process that requires a continuous, proactive approach. This is why engineering teams that truly want to prioritize reliability use SLOs.

SLO concepts

An SLO sets a reliability target for a service and continuously tracks real performance against it. Three prerequisite concepts teams should understand when setting SLOs for MTTR are:

Service Level Indicator (SLI): the ratio of good events to all valid events, measured continuously: e.g., the proportion of checkout requests served successfully within 200 ms.

Service Level Objective (SLO): the target for that indicator (SLI) over a defined window, such as 99.9% across a rolling 28 days.

Error budget: the share of valid events that may fall short of the SLI without breaching the SLO. At 99.9%, this is 0.1% of valid checkout requests in the 28-day window. Both failed requests and successful requests that take longer than 200 ms count against it. If the service handles 1,000,000 checkout requests in that window, up to 1,000 can miss before the objective is breached.

Together, these concepts show whether a service is delivering the level of reliability its users need, measured continuously rather than reconstructed after an incident. This relationship is illustrated in the graphic below.
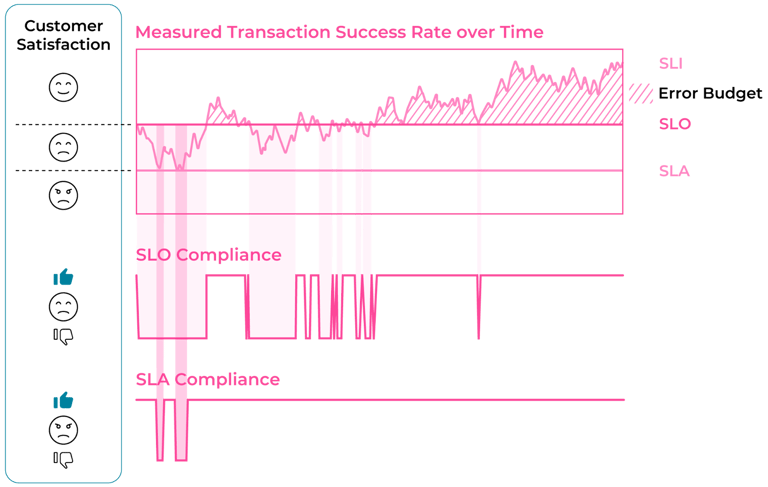
mttr-customer-satisfaction

Customer satisfaction mapped to the concepts of SLIs, SLOs & SLAs (Source)

These three simple concepts, therefore, provide a framework that enables teams to:

  • Continuously monitor performance and reliability
  • Define target reliability thresholds acceptable to end users and customers
  • Continuously measure reliability degradation rates against target thresholds

This natural extension of monitoring represents the end user’s actual experience and, in doing so, gives engineers a continuous, actionable signal to maintain reliability.

Relating SLOs to MTTR

SLOs address MTTR’s key shortcomings with three main functional characteristics:

  1. Continuous measurement over rolling windows: Because SLIs compute performance as a ratio over a rolling time window, they capture the total volume of failures better.
  2. Automated telemetry calculations: SLIs rely on real-time data from your monitoring tools, eliminating subjective, manual timing and preventing misreporting.
  3. Direct alignment with user experience: SLIs focus on user-facing metrics such as latency and success rates, giving you continuous visibility into customer impact without waiting for an incident ticket to be opened or resolved.

Composite SLOs

Composite SLOs allow teams to extend the model to cover complete user journeys. A composite SLO is an overall reliability target built by aggregating per-service targets (objectives).

For example, a customer completing an online purchase interacts with multiple services, all of which contribute to overall reliability and user experience. A composite SLO aggregates several objectives, weighted by business importance, into a single budget that is consumed whenever any constituent component is consumed. Nobl9's composite SLOs implement this pattern.

Visit SLOcademy, our free SLO learning center

Visit SLOcademy. No Form.

Comparing SLOs with MTTR metrics

The concepts that are integral to SLOs can be compared with the assessment criteria used for MTTR software as follows:

Dimension

MTTR metrics

SLOs

Unit of measure

Duration of an incident

Ratio of good events to valid events

When it signals

Post-mortem, only the following resolution

Continuously, including mid-incident

Statistical robustness

Mean over a skewed, low-count sample

Ratio over the full event population

User-impact fidelity

Severity for the user is assessed and assigned manually

Direct - provided the SLI is defined on user-facing signals

Susceptibility to gaming

High: timings are often set by individuals

Low: timings are computed rather than declared

Decision support

Enables decisions and analysis only retrospectively

Remaining error budget steers decision to ship features or stabilize operations

Reporting to a non-technical audience

Strong - metrics require little explanation

Requires a shared understanding and vocabulary first

This also allows us to revisit the primary deficiencies of MTTR metrics discussed above and contrast how SLOs respond in those situations to address the weaknesses and close the gap:

MTTR deficiency

SLO response

Subjective, open to interpretation, and gameable

Indicators are computed and recorded automatically and continuously from telemetry

Averages as metrics conceal significant outages

Indicators count every event against a target, so no mean distorts the data or absorbs the tail

Signals after users were impacted, and only measures operational response efficiency

Error budget consumption provides a live and continuous signal to help avoid incidents and to reflect what users are experiencing at any moment in time

MTTR nevertheless retains one clear advantage: it is universally understood and appeals to a broad audience. It also translates into contractual language and requires little to no onboarding. MTTR metrics can therefore coexist with SLOs because of their relevance to external reporting. Meanwhile, SLOs are clearly the better basis for steering engineering decisions and, ultimately, maintaining strategic reliability.

So, when evaluating reliability software, establish whether SLIs can be defined on user-facing signals drawn from your existing telemetry, whether latency objectives support percentile thresholds rather than averages, and whether the product supports journey-level composites or only per-service objectives.

The key contribution of SLIs, SLOs, and their error budgets to reliability is that they measure and articulate a commitment across the entire user journey: what occurred, what was promised, and how much of the promise remains.

SLO error budgets

Alerting on an error budget's burn rate provides a genuine, live operating signal. This is the key signal that drives engineering teams and their day-to-day decisions.

An error budget behaves as a running balance rather than a retrospective average. Each bad event draws it down as it occurs, so at any moment, the figure shows how much tolerance remains and how quickly it is being consumed. Alerting on the rate of consumption, rather than on absolute thresholds, produces two distinct signals:

  • Fast burn indicates a sharp spike that consumes the budget in a short time window - this puts the reliability at immediate risk.
  • Slow burn identifies a gradual drain over a longer window - the condition is real but constitutes a trend rather than an emergency.

Fast versus slow burn requires different approaches to alerting and response. A single-threshold SLO creates a challenge around when to alert and how to respond, depending on whether the burn rate is fast or slow. Get it wrong, and alert fatigue can set in.

Multi-window, multi-burn-rate policies resolve this by requiring the burn to persist across both short and long windows before firing, thereby detecting severe incidents promptly while suppressing false alarms.

The Google SRE Workbook chapter on alerting describes window configuration and computation. Nobl9 implements fast and slow burn as follows:

apiVersion: n9/v1alpha
kind: AlertPolicy
metadata:
  name: fast-burn
  project: default
spec:
  alertMethods: []
  conditions:
  - alertingWindow: 15m
    measurement: averageBurnRate
    op: gte
    value: 5
  - alertingWindow: 6h
    measurement: averageBurnRate
    op: gte
    value: 2
  coolDown: 5m
  description: "Multiwindow, multi-burn policy that triggers when your service requires attention and prevents from alerting when you're currently recovering budget"
  severity: Medium

Multiwindow, multi-burn policy defined in code (Source)

To provide value, a signal should enable a decision, so budget policies should attach actions to thresholds. For example:

  • Notify the team channel when the remaining error budget is at 50%
  • Prioritize reliability work when the remaining error budget is at 25%
  • Freeze non-essential deployments when the error budget has been exhausted

The final bullet demonstrates that reliability can be enforced as a constraint on what the team ships next. Burn your error budget and the team can no longer deploy new features.

Reliability software should therefore support multiple windows and burn rates per objective, and should enable budget thresholds to trigger actions rather than notifications alone.

The key distinction here is that burn-rate alerting should be evaluated on its ability to detect gradual degradations. A sustained 2x burn, for example, exhausts a 30-day budget in 15 days without an outage ever being declared - MTTR software would never detect or report on such a genuine decline.

Backtesting and SLOs-as-code

Reliability software should also have features that ensure SLO reliability targets are realistic, evidence-based, and easy to maintain.

Aspirational targets or objectives based purely on theory are likely to hinder adoption and encourage teams to ignore the resulting alerts. It is far better to implement reliability targets from actual measured behavior, targets that the whole team recognizes and endorses.

Nobl9's SLI Analyzer can preview the budget burn-down that a proposed target would have produced. Additionally, Replay recalculates an existing objective's budget history after a target change and backfills gaps in the record. These tools give engineering teams confidence that reliability goals are achievable, meaningful, and, ultimately, worth defending.

SLOs-as-code enables teams to maintain reliability definitions alongside their infrastructure and application code, making reliability an integral part of code reviews and release approvals. Declarative definitions live under version control alongside the service they describe, so changes to the target go through the same review as changes to the code, embedding reliability into standard developer processes and ensuring ongoing maintenance, visibility, and alignment with existing code.

OpenSLO is the vendor-neutral specification defining a service’s reliability target:

apiVersion: openslo/v1
kind: SLO
metadata:
  name: checkout-latency
spec:
  service: checkout
  indicator:
    metadata:
      name: checkout-request-latency
    spec:
      ratioMetric:
        good:
          metricSource:
            type: Prometheus
            spec:
              query: sum(rate(http_request_duration_seconds_bucket{job="checkout",le="0.2"}[5m]))
        total:
          metricSource:
            type: Prometheus
            spec:
              query: sum(rate(http_request_duration_seconds_count{job="checkout"}[5m]))
  budgetingMethod: Occurrences
  objectives:
    - displayName: 99% of checkout requests under 200ms
      target: 0.99
  timeWindow:
    - duration: 28d
      isRolling: true

Example snippet of declarative SLO definition using OpenSLO spec. (Source)

Computing SLIs from telemetry already collected from existing monitoring tools is preferable to requiring that data be sent to a further destination. Some monitoring tools include integrated SLO features that work over their own data, which works well when a single platform holds everything. A dedicated SLO layer, however, ensures that signals for a user journey, which may be distributed across several monitoring platforms, provide a complete view of reliability rather than data that terminates at a tooling boundary.

For adoption, select two or three user-facing indicators on one critical service, then backtest the targets against 30 days of historical data. Define one budget policy with a substantive action attached. Operate the legacy MTTR reporting alongside it for a quarter, then compare which of the two changed a decision. The SLODLC worksheets and the SLO best practices guide provide a repeatable process for this implementation phase.

The key here is that SLO adoption can stall with unrealistic or uninformed targets. So, backtesting is an inexpensive insurance against selecting a figure that inadvertently encourages the team to disregard the objective.

Learn how 300 surveyed enterprises use SLOs

Download Report

Last thoughts

While MTTR only provides a retrospective measure of reliability incidents and organizational performance, there are clear organizational benefits for tracking it:

  • Its usefulness to stakeholders
  • Its relevance in SLA discussions,
  • Its role as the source of a well-instrumented incident timeline that is worth having regardless of what else is measured

For meaningful control and reliability improvement, however, software should offer live error budgets and burn-rate alerting based on service-level indicators derived from the user's direct experience. This provides a live signal that steers engineering decisions and helps catch issues before they become incidents.

Ultimately, organizations tend to improve only what they measure, so they should avoid selective reporting of metrics and instead use MTTR for non-technical outward reporting, while using SLOs to drive reliability by informing and guiding daily engineering practices.

Navigate Chapters:

Continue reading this series