Table of Contents

Maintaining service reliability is one of the fundamental obstacles preventing Kubernetes administrators from regularly managing Kubernetes costs. In a perfect world, this should be a routine and everyday part of operations. Kubernetes administrators are always under pressure to reduce costs, but they can’t afford guesswork when making resource reductions. At the heart of this friction is the need to maintain reliability.

Service-level objectives (SLOs) provide a framework for teams to continuously optimize Kubernetes costs while maintaining reliability. In this article, we explore the best practices in managing Kubernetes costs while prioritizing reliability.

Key Kubernetes cost management best practices

Best practice

Description

Size resources based on actual usage

Set requests below observed peak usage to eliminate waste while maintaining headroom for traffic spikes. Track infrastructure changes with SLO annotations to see how adjustments affect reliability.

Set up cost-effective autoscaling

Trigger scaling before hitting resource limits, and configure cooldown periods. Test configurations with SLO backtesting before deploying changes.

Schedule pods strategically

Use node affinity and priority classes to control placement. Use spot instances with fallback strategies for non-critical workloads. Commit to reserved instances for stateful workloads and use commitment-based discounts for baseline capacity.

Enforce quotas and track results

Set limit ranges for default container limits and resource quotas by namespace to cap spending. Monitor cost per request alongside latency to catch when optimizations degrade performance.

Clean up unused resources

Implement persistent volume retention policies with automated cleanup. Replace individual load balancer services with shared Ingress controllers. Keep data-insensitive workloads in the same availability zone to minimize cross-zone data transfer costs.

Use cost visibility tools

Deploy open source tools for metrics and dashboards. Use cloud provider tools for native billing insights. Integrate reliability monitoring to prevent cost cuts that break SLOs.

Customer-Facing Reliability Powered by Service-Level Objectives

Service Availability Powered by Service-Level Objectives

Learn More

Integrate with your existing monitoring tools to create simple and composite SLOs

Rely on patented algorithms to calculate accurate and trustworthy SLOs

Fast forward historical data to define accurate SLOs and SLIs in minutes

Size resources based on actual usage

One of the primary sources of overspending in Kubernetes is overallocation of resources. The first thing engineering teams should look at is right-sizing resource allocation.

Overallocation is a natural tendency at first when you lack data on how workloads actually behave in production environments under real usage. When attempting to reduce container resource usage, developers often rely on intuition and guesswork.

Service-level indicators (SLIs), service-level objectives (SLOs), and error budgets provide a ready-made framework that removes the guesswork from cost decisions. An SLI measures a specific aspect of system behavior, such as request latency, error rate, or availability. An SLO sets the target for that metric: for example, "99.5% of requests must complete in under 200 ms over a 30-day window." An error budget then quantifies the gap between perfect reliability and your SLO target. For example if your SLO is 99.5% availability, your error budget is 0.5% which is roughly 3.6 hours of downtime per month. That's the tolerable failure headroom before breaching the objective.

Before reviewing resource usage, SRE teams should check the status of the error budget. It tells them immediately whether they have headroom to reduce resources or whether they should leave them alone.

Error budget status

What it means

Impact

Engineering priority

Healthy

The burn rate is low and the budget is intact.

There is enough failure headroom to spare before the window closes.

Right-size and optimize aggressively.

At risk

The burn rate is elevated and the budget may deplete before the window closes.

Further instability could exhaust the budget early.

Apply only low-risk changes and watch burn rate closely.

Depleted

The budget is significantly consumed and reliability is already strained.

Any further failures risk breaching the SLO.

Freeze resource changes and restore reliability first.

Historical metrics show the usage profile over time, which can then be compared against SLO compliance to confirm the reliability impact of any allocation change. A good metric to keep an eye on for right-sizing is container usage relative to the requests and limits in the pod specifications.

For a simple point-in-time snapshot, teams can use kubectl top (requires the metrics-server add-on) as follows:


# CPU & memory per-pod
kubectl top pods -n 

# CPU & memory per-container
kubectl top pods -n  --containers


# CPU & memory per-node
kubectl top nodes

If metrics-server is not available, teams can query cgroup stats inside pods:


# Memory usage in bytes
kubectl exec  -- cat /sys/fs/cgroup/memory/memory.usage_in_bytes

# CPU cumulative usage in nanoseconds
kubectl exec  -- cat /sys/fs/cgroup/cpuacct/cpuacct.usage

# On cgroup v2 systems use v2-specific paths:
# /sys/fs/cgroup/memory.current, /sys/fs/cgroup/cpu.stat

Using this data as a measure of actual usage, teams can then compare with allocated resources to determine if pods are under- or over-provisioned:


# Determine the reserved and limited resources
kubectl describe pod  | grep -A3 "Requests\|Limits"

# Determine resources for all pods using field selectors
kubectl get pods -n  -o json | \
  jq '.items[] | {name: .metadata.name, containers: [.spec.containers[] | {name, resources}]}'

For longer-term analysis, teams can use their metrics data for trends and peaks to inform right-sizing decisions. For example, key Prometheus metrics include:

  • container_cpu_usage_seconds_total
  • container_memory_working_set_bytes
  • container_memory_rss

The Vertical Pod Autoscaler (VPA) Recommender can also analyze historical usage and suggest appropriate request and limit values.

Against this backdrop of continued resource adjustments, SLOs can provide the evidence layer to justify the changes and give engineers confidence when applying them.

SLO annotations can also be extremely valuable here. When implementing resource modifications, platforms like Nobl9 enable teams to annotate their SLO reliability timeline charts with contextual events to indicate what changed and when.

For example, a point-in-time or specific time window can be highlighted with an SLO annotation that represents a deployment, incident, or configuration change. This makes it ideal for tracking when pod resources were modified.

As an example, Nobl9 annotations can be applied with sloctl apply -f, using the kind: Annotation resource:


apiVersion: n9/v1alpha
kind: Annotation
metadata:
  name: resource-adjustment-1234
  project: appname
spec:
  slo: appname-availability
  description: "Applied container resource right-sizing adjustment in PBI 1234"
  objectiveName: slo-objective-1
  startTime: 2026-04-01T14:30:00Z
  endTime: 2026-04-01T14:45:00Z

This allows teams to track changes over time and to see how they affect reliability.

Customer-Facing Reliability Powered by Service-Level Objectives

Service Availability Powered by Service-Level Objectives

Learn More

Set up cost-effective autoscaling

For cost-effective autoscaling, SLI metrics make a superior scaling trigger than CPU alone. By default, the Horizontal Pod Autoscaler (HPA) scales additional pod capacity based on CPU utilization, which only increases after requests begin queuing. This can result in engineers setting HPA minimum replicas conservatively high, which unnecessarily inflates baseline costs when traffic is low.

Scaling on SLIs rather than CPU closes this lag and removes the need for over-provisioning. When HPA is configured via the Kubernetes-based Event-Driven Autoscaler (KEDA) to trigger on p99 (99th percentile) latency approaching its SLO threshold (or on request queue depth exceeding a defined level), scale-out begins when user experience starts to degrade, not when CPU has caught up. This allows minimum replica counts to be set at levels that genuinely reflect off-peak traffic requirements.

A simplified example can be illustrated as follows, where the scaling threshold (400 ms) for a checkout service is set just below the SLO threshold (500 ms) to maintain reliability:


apiVersion: keda.sh/v1alpha1
kind: ScaledObject
metadata:
  name: checkout-latency-scaler
spec:
  scaleTargetRef:
    name: checkout-service
  minReplicaCount: 3
  maxReplicaCount: 20
  triggers:
    - type: prometheus
      metadata:
        serverAddress: http://prometheus.monitoring.svc:9090
        query: |
          histogram_quantile(0.99,
            sum(rate(http_request_duration_seconds_bucket{
              service="checkout-service"
            }[5m])) by (le)
          )
        threshold: "0.4" # Scale when p99 hits 400ms (SLO is 500ms)
        activationThreshold: "0.3" # Scaler inactive below 300ms

Example KEDA auto-scaling definition that scales using SLO thresholds

Going one step further, teams can consider scaling on an SLO’s error budget burn rate, which is particularly well-suited to autoscaling decisions.

A burn rate alert that fires when the error budget is being consumed faster than the rolling window allows offers a high-confidence signal that the service is under-resourced relative to current demand. This alert can drive a scaling event (via KEDA or otherwise), which prioritizes scaling for reliability and helps reduce noise-driven scaling.

It’s worth mentioning that scale-in behavior is just as important from a cost perspective. Aggressive scale-in that removes pods before traffic has fully subsided can erode an error budget and trigger immediate scale-out. Configuring scale-in to require that SLIs have been healthy for a sustained period before reducing replica count prevents this oscillation.

SLO backtesting can also be used here to ensure that cost-saving measures do not compromise reliability. Backtesting allows teams to simulate how a proposed change in HPA policy (e.g., minimum replicas, scaling metrics, or scale-in cooldown periods) would have performed against historical traffic patterns. For example, a team considering reducing HPA minimums overnight for cost savings can validate their proposed configuration against a look-back period of traffic before implementing the actual change. You can see here how Nobl9 makes this possible with its SLI Analyzer.

Schedule pods strategically

Pod scheduling decisions have direct cost implications, so they are best made with a data-driven process behind them. When scheduling, you are defining which nodes receive which pods, how pods are distributed, and which workloads share node capacity. It therefore helps to classify your workloads, and one way to do this is by using SLO tiers.

By classifying your workloads, you avoid critical and non-critical workloads ending up on the same node pool cost tier (e.g., on-demand). Using SLO tiers or similar, node placement can be derived from the workload’s classification, cost rating, and sensitivity to interruption:

  • Critical tier workloads can be placed onto on-demand multi-AZ.
  • Standard tier workloads can be assigned to mixed on-demand and spot.
  • Batch tier workloads can go to spot-first with scale-to-zero overnight.

Node placement can also be controlled by node affinity and priority classes. Node affinity controls where a pod can run, whereas priority classes control which pods survive when resources are scarce. When used together, these options help classify your nodes and prioritize your workloads for precise control over both placement and precedence.

Interruption rates can also indicate cost-optimization areas. Low rates can indicate an overly conservative mix of instance types, while a high rate (that is impacting SLOs) can suggest a workload that needs a more predictable instance type or an adjustment to pod disruption budgets.

SLO annotations can be used to record spot interruption events and their impact on SLI measurements. This can be used to build evidence for workloads that tolerate interruptions (or do not) while preserving reliability. This approach can help provide engineers with confidence to move such workloads to lower-cost node pools.

Workload concentration is also worth examining to detect spending waste. Low bin-packing efficiency on your nodes (many nodes running at low utilization rates because pod resource requests are generous relative to actual usage) presents opportunities to reduce node counts and thereby lower base infrastructure costs.

Tracking bin-packing efficiency over time also reveals the effects of governance decisions, such as namespace quotas and resource request enforcement. When teams are required to set realistic resource requests (enforced via admission controllers, for example), bin-packing efficiency typically improves because the scheduler can place pods more densely.

Visit SLOcademy, our free SLO learning center

Visit SLOcademy. No Form.

Enforce quotas and track results

SLIs provide a useful guardrail and reliability perspective for confidently enforcing resource usage limits to constrain Kubernetes costs. This can be especially useful when discussions of enforcement levels lack evidence or create tension between administrators and development teams.

Data from metrics provide precise resource utilization figures, but SLIs add the necessary context to understand the real impact on reliability and user experience. Used together, they remove the guesswork when establishing safe resource enforcement limits.

A common way for cluster administrators to avoid unconstrained cluster usage and generally enforce limits on individual teams is through the use of resource quotas and limit ranges:

  • Limit ranges are policies that enforce resource usage limits for individual objects within a namespace.
  • Resource quotas are policies limiting the aggregate use of all resources by a single namespace.

Used together, these allow cluster operators to enforce sensible per-workload limits and fair usage of the entire cluster by namespace.

Administrators can cap spending by applying default resource usage limits on containers for teams that schedule workloads without setting resource request and limit values. This can be done by defining a LimitRange object as follows:


apiVersion: v1
kind: LimitRange
metadata:
  name: default-limits
  namespace: production
spec:
  limits:
    - type: Container
      default: # Applied if no limits are set on the container
        cpu: "500m"
        memory: "256Mi"
      defaultRequest: # Applied if no requests are set
        cpu: "100m"
        memory: "128Mi"
      max:
        cpu: "2"
        memory: "1Gi"
      min:
        cpu: "50m"
        memory: "64Mi"

Example LimitRange object enforcing default and maximum values for individual containers

Similarly, cluster operators can limit spending at the namespace level by defining a constraint on total namespace resource usage via a ResourceQuota object:


apiVersion: v1
kind: ResourceQuota
metadata:
  name: team-quota
  namespace: production
spec:
  hard:
    requests.cpu: "10"
    requests.memory: "20Gi"
    limits.cpu: "20"
    limits.memory: "40Gi"
    pods: "50"
    services: "10"
    persistentvolumeclaims: "15"

Example ResourceQuota object enforcing a ceiling of resource usage across an entire namespace

Defining these limit levels can be contentious, so SLIs provide a valuable source of evidence for justifying what is actually required.

When examined over an appropriate look-back window, SLI data can demonstrate the reliability experience resulting from the metrics data, such as average and peak resource utilization. SLI data will also highlight any trends in reliability, especially when viewed over multiple right-sizing exercises or changes in service demand. With additional consideration of headroom within the related SLO bounds, this informs discussions of appropriate enforcement levels.

SLO error budgets also provide useful insight here into the optimal limits on resources and spending. For example, if a service's error budget burn rate exceeds a defined threshold, or if resource utilization is close to the pod’s limit ranges or the namespace’s resource quota ceiling, then this indicates that the quota may be constraining the service's ability to maintain its SLO. Conversely, a service with a consistently healthy error budget well below its quota ceiling is a signal to lower the limits.

As a simple example, consider an analysis that indicates that a container is using 200m of CPU while it requests 2000m. This looks like an obvious right-sizing opportunity, yet that metric alone does not tell application teams whether it is safe to reduce the request value in the pod spec. The SLI, however, answers that question: If p99 latency is healthy, the CPU throttling rate is near zero, and the error budget burn rate is stable, the SLI data confirms genuine headroom. If p99 is elevated and throttling is non-trivial, the SLI reveals that the low average is deceptive and that the container is hitting its limit during peaks that the average masks.

This is a key aspect of SLIs. They capture the integrated effect of all peaks and troughs on the user experience over a rolling window.

Monitoring error budget burn rates and alerting at different levels of error budget consumption lets teams proactively ensure that resource spending is proportionate while validating that enforced resource usage levels are not impacting reliability.

The following Nobl9 dashboard example shows how teams can monitor error budgets:

Example error budget dashboard summary showing error budget status for different services

Similarly, individual service health can be analyzed in terms of error budget burn rates and SLO annotations showing events or configuration changes (e.g., new resource limits) and used as input to appropriate right-sizing of enforced resource limits. An example Nobl9 dashboard showing service health by error budget burn rate helps illustrate this.

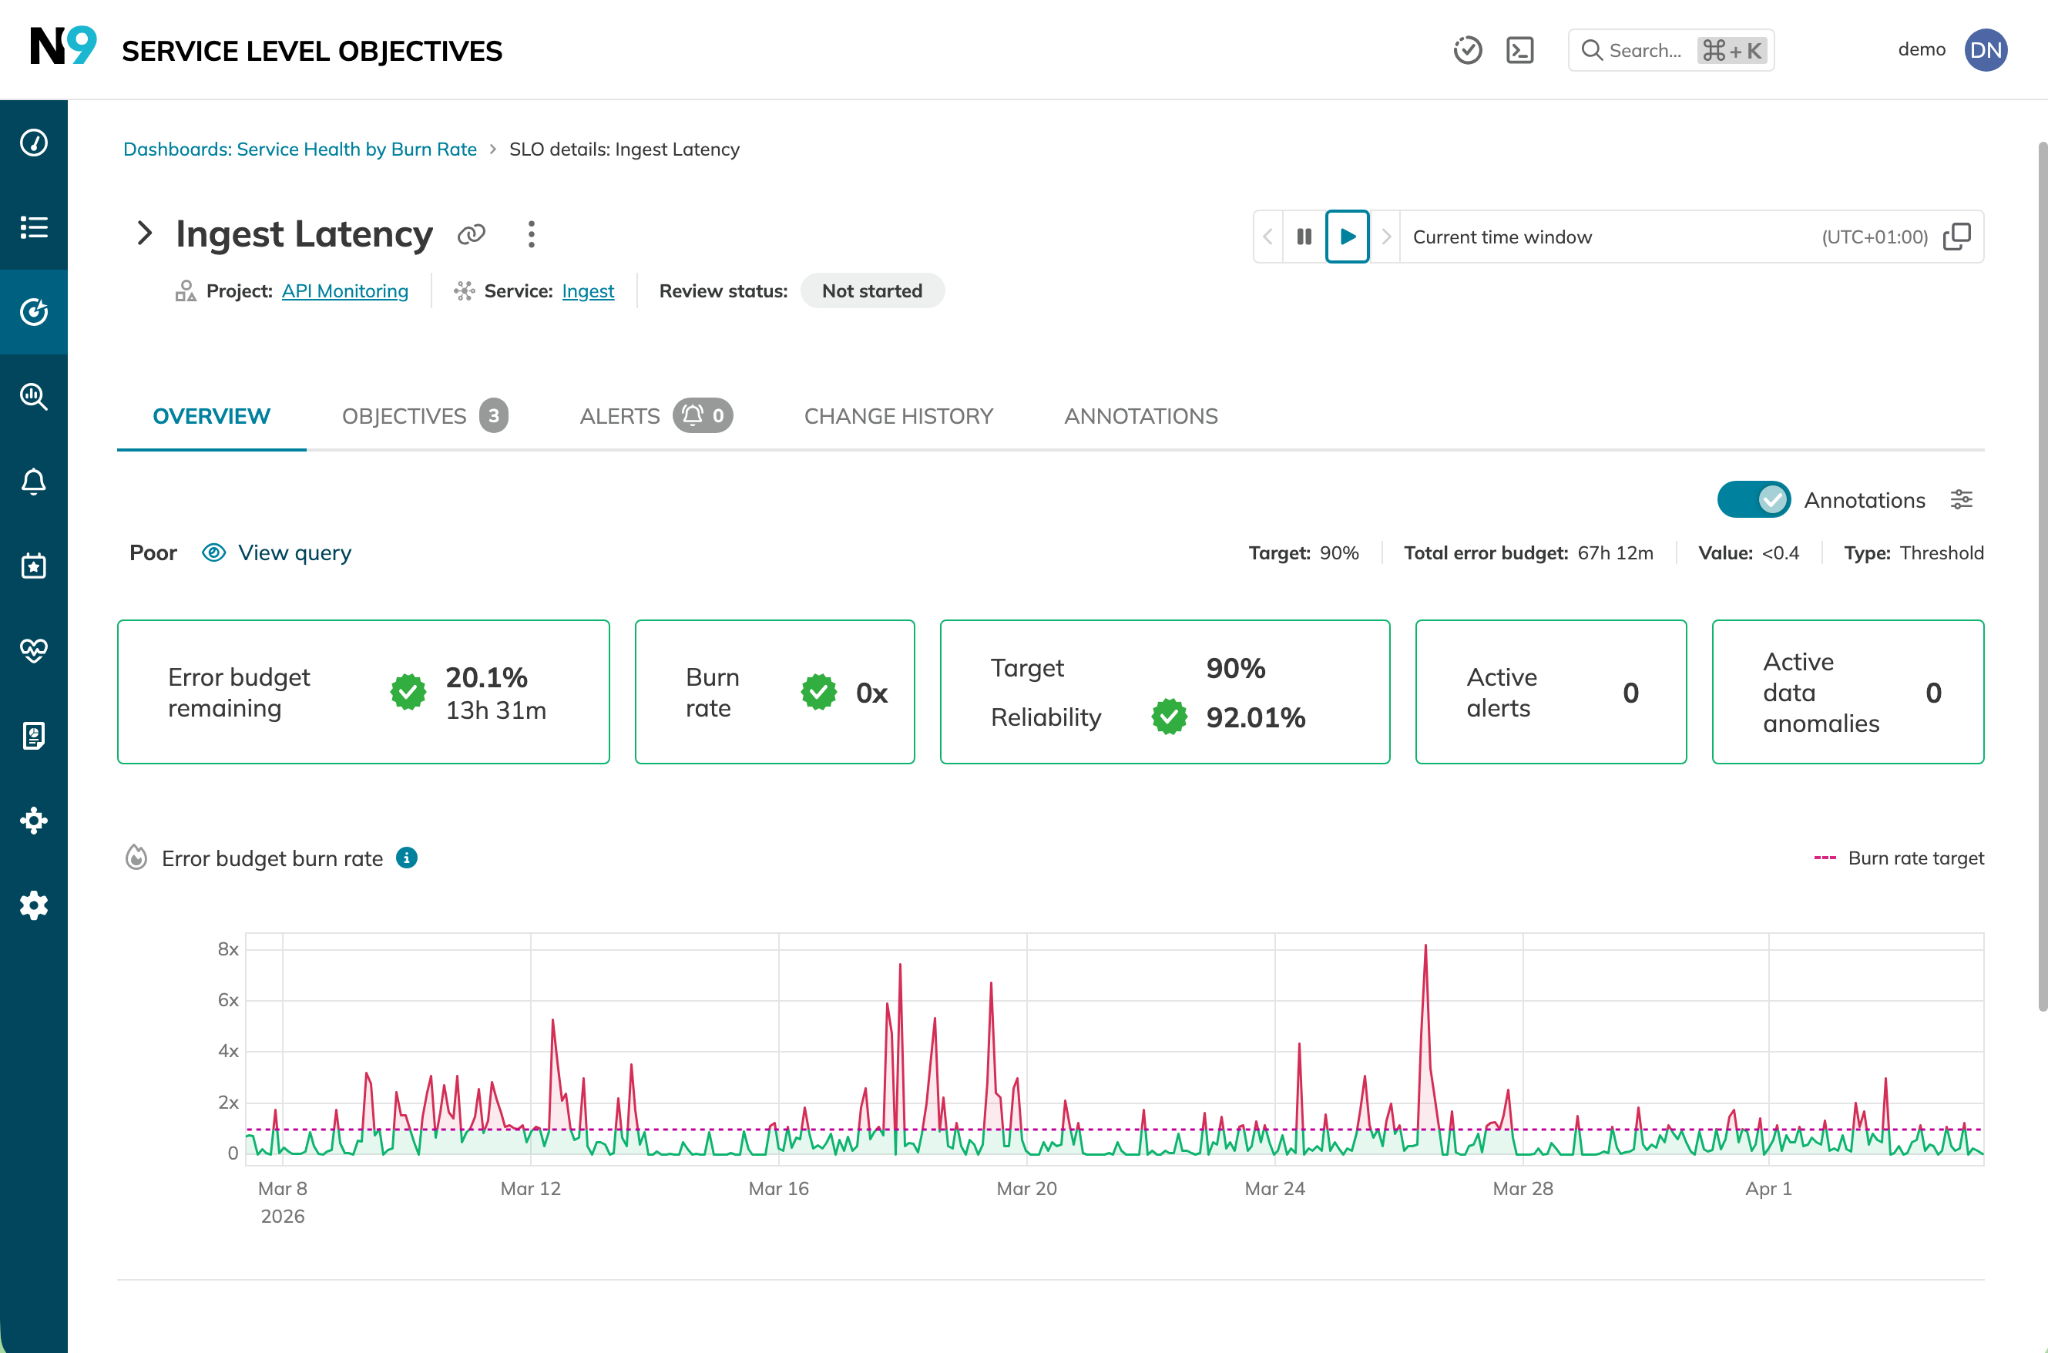
Example service health dashboard showing error budget burn rate

These examples show how costs can be managed by enforcing limits on resource usage, how SLI data is used to right-size those limits based on real usage, and how SLO compliance is used to verify that the limits don't compromise reliability.

Learn how 300 surveyed enterprises use SLOs

Download Report

Clean up unused resources

Orphaned and idle resources are a persistent source of Kubernetes waste. Tackling this avoidable, unnecessary spend delivers immediate benefits, though identifying genuinely orphaned resources versus those simply experiencing low traffic periods is not always simple.

SLOs can assist platform teams in several ways here:

  • SLO annotations, which are metadata markers on an SLO timeline, can record expected low-traffic periods to prevent misidentifying seasonally quiet services as idle or orphaned.
  • Services with zero SLI data or error budget alerting over predefined rolling windows can be flagged as genuinely unused.
  • Services not registered with an SLO can be subject to more aggressive scaling and cleanup.

Looking beyond individual workloads, cluster infrastructure can also be optimized to avoid unnecessary waste:

  • Persistent volumes can be subject to retention policies with automated cleanup.
  • Individual load balancer services can be replaced with shared gateway APIs.
  • Cross-zone data transfer costs can be minimized by using the same availability zone where possible.

Use cost visibility tools

Cost visibility tools can also assist platform and engineering teams in identifying sources of waste, such as over-provisioning or areas of significant spend. Proprietary FinOps platforms or open source tools like OpenCost and Kubecost help teams generate cost and allocation data across infrastructure, namespaces, workloads, and containers.

SLOs add context to this cost data by reflecting each service's criticality and error budget status. This indicates whether a given service has the reliability headroom for reductions in resource allocation and spending.

SLO criticality tiers can also be used to correlate investment levels with reliability requirements and outcomes, which can highlight where reliability investment is being made and where it is being over-invested. If 70% of compute spend is in the critical tier but only 30% of workloads carry a critical SLO, that disparity signals either that SLO tier labels are applied too conservatively or that workloads have accumulated in the critical tier without the business justification to make the spend proportionate.

Billing dashboards also benefit from being linked to SLO timelines, as SLO annotations can help interpret the real reasons behind cost and traffic spikes. SLO tools like Nobl9 can therefore provide the reliability context behind cost allocation and spending. Put another way, SLO data can prevent uninformed cost-cutting from ultimately impacting the end customer.

This is obviously an ongoing challenge, so to deliver compounding long-term value, teams can use their SLOs to create a feedback loop between cost and performance. Through regular review cycles, the architectural evolution, reliability trends, and spending profiles can be continually compared to provide a complete picture of the value proposition arising from engineering and development efforts.

Try our SLO Implementation ROI Calculator

Try ROI Calculator

Last thoughts

Managing costs and maintaining reliability are two sides of the same coin. To manage the costs of Kubernetes workloads, both factors need to be used as inputs for effective, consistent operations.

Service-level objectives, along with service-level indicators, provide a ready-made framework that maintains reliability, guides the engineering and development team's risk levels, and removes the guesswork from cost management solutions. By fully integrating SLOs and SLIs with cost-control solutions and applying these practices in a continuous feedback loop, Kubernetes engineering teams and product owners can succeed with confidence in their dual mandates: reliable and cost-effective operations.

Navigate Chapters:

Continue reading this series