
-1.png)

Table of Contents
Like this article?
Subscribe to our Linkedin Newsletter to receive more educational content
Subscribe nowWhen organizations talk about incident management, they often mean the visible part of the work: triage calls, mitigation steps, timelines, and postmortems.
The purpose of incident management goes beyond that. Incidents in aggregate reveal where systemic risk is accumulating and whether reliability is trending in the right direction.
An error budget translates a reliability target into a concrete allowance: the amount of downtime or degradation a service can experience before it breaches its SLO commitment. That allowance becomes the common unit that makes incidents comparable, prioritization defensible, and reliability conversations grounded in user impact rather than engineering opinion. This is why anchoring incident management to SLOs and error budgets shifts the focus from day-to-day operations to reliable outcomes.
This article treats that as a governance discipline, examining the key metrics that emerge after incidents occur and the patterns and risk indicators that inform decisions.

SLO-based incident management is a decision-making process. (source)
Summary of key incident management metrics
|
Metrics |
Description |
|
Error budget consumption per incident |
Expresses incident impact as a percentage of error budget consumed rather than a subjective severity label. It makes incidents comparable across services with different architectures and traffic patterns. |
|
SLO violation frequency |
Counts SLO boundary crossings within a defined window, not tickets or alerts. Distinguishes services that fail rarely but severely from those that wobble chronically near their reliability threshold. |
|
SLO-based recovery time |
Measures when the error budget burn stabilizes after an incident, not when the incident call ends. Exposes the gap between operational recovery and actual reliability recovery. |
|
Incident-induced burn rate spike |
Tracks how fast the error budget is consumed during an incident, not just how much. A short incident with a steep burn rate spike often carries more risk than a longer, slower degradation. |
|
Error budget recovery trend |
Examines the trajectory of the error budget across quarters. Determines whether a service is rebuilding its reliability margin after a disruption. |
|
Dependency-driven incident impact |
Traces reliability degradation back to its origin across service boundaries. Surfaces cases where a team's SLO violations are caused by a shared dependency rather than service behavior. |
Error budget consumption per incident
When an incident closes, the only record of how serious it was is the severity label assigned during the chaos of response. That label reflects how urgent things felt, not how much damage was actually done.
Error budget consumption per incident replaces guesswork with a measurement: the percentage of the service reliability allowance that the incident consumed.
It exposes how misleading other common incident response metrics can be. Consider two incidents:
- A 10-minute outage on a critical checkout flow consumes 12% of the monthly error budget.
- A 3-hour degradation on a low-traffic reporting feature consumes 0.4%.
The second looks worse by every operational measure: longer duration, more escalations, more noise. But the first did 30 times more damage to reliability. If prioritization follows the noise, investment goes to the wrong place.
Implication
Error budget consumption per incident makes incidents comparable across services with different architectures, traffic patterns, and team conventions.
Because consumption is expressed as a percentage of the budget, the unit is self-normalizing. For instance, a service with 1,000 requests per second and one with 10 are each measured against their own objectives, not each other's. This makes cross-service prioritization defensible and shifts how severity is assessed.
Instead of assigning a label during response, severity is an output calculated after the fact from measured impact. Once you can quantify how much reliability an incident consumed, you can start asking how often that boundary gets crossed in the first place.

Reliability can be quantified by measuring how much error budget an incident has consumed. (source)
SLO violation frequency
Error budget consumption tells you how much reliability an incident cost. It doesn't tell you whether the service is stable. Two services can consume an identical budget in a quarter and behave very differently:
|
Service A |
Service B |
|
|
Budget consumed |
8% |
8% |
|
SLO boundary crossings |
1 |
6 |
|
Pattern |
Single contained outage |
Chronic shallow violations |
Service B has a structural problem that total consumption obscures. This signal is valuable during quarterly reviews as no single shallow violation triggers escalation, and chronic instability can accumulate unnoticed.
Implication
SLO violation frequency counts boundary crossings within a defined window, going beyond traditional tickets, alerts, and incidents. Many services never fail dramatically, but if minor incidents recur, they point to deeper issues, such as:
- Tight capacity margins
- Fragile integrations
- Design constraints that only surface under certain conditions.
This matters for planning as much as it does for reliability. A service that frequently crosses its SLO boundary creates uncertainty that shows up in roadmap decisions and release confidence, even when the total budget loss looks manageable. This is why violation frequency answers a different question than consumption. Is the service in control of its own reliability?
Customer-Facing Reliability Powered by Service-Level Objectives
Service Availability Powered by Service-Level Objectives
Learn More
Incident-induced burn rate spike
Recovery time tells you how long it took for a service to stabilize. Burn rate tells you how violently it fell apart in the first place.
A system that drifts into trouble gives teams time to respond. One that collapses under stress moves from healthy to well outside its objective in minutes, consuming reliability margin before most response procedures can engage.
Beyond how much budget is consumed by the end, incident-induced burn rate spike measures acceleration: how aggressively reliability deteriorates once disruption begins.
Importance of the observation window
The observation window matters here. Short windows surface sharp, concentrated deterioration. Longer windows smooth those spikes into broader trends. Both are useful, but they answer different questions.
|
Burn pattern |
What it signals |
Common causes |
|
Sharp spikes |
Little buffer between normal operation and user impact. The system reacts abruptly when stressed. |
|
|
Slow burns |
The system degrades with friction, giving teams time to respond before the SLO is breached. |
|

Short observation windows surface sharp, concentrated reliability deterioration. Longer windows smooth out those spikes and reveal broader reliability trends. Both perspectives are valid, but they answer different questions about risk. (source)
Implication
A steep burn rate during an unusually severe load event reflects the incident conditions rather than a structural flaw, so spike severity needs context before it drives decisions.
That said, the pattern across multiple incidents is harder to dismiss. A service that consistently shows steep acceleration during failure has a systemic problem. It does not appear in steady-state metrics but surfaces reliably under stress.
Burn rate behavior also reframes how short incidents get interpreted. A brief disruption can look minor by duration alone, but if reliability deteriorated rapidly during that window, the service enters a high-risk state regardless of how quickly it recovered.
Once the burn rate is mapped across incidents, teams should shift focus from individual events to trajectory or trends.
- Does the service maintain a stable reliability posture over time?
- Does each disruption leave behind a subtle decline that compounds across quarters?
Error budget recovery trend
Burn rate behavior tells you how a service fails. The recovery trend tells you whether it's becoming more or less resilient over time. The distinction matters because a service can return to operation after an incident without being fully healthy. Metrics normalize, traffic flows, and the incident may be resolved, but the underlying margin may be thinner than before.
What makes degradation hard to catch is that there's rarely a headline event to trigger concern. Burn rate climbs gradually, load sensitivity increases, and by the time the pattern is obvious, remediation requires structural redesign rather than incremental fixes.
Multi-window, multi-burn alerting addresses this directly. Rather than firing on a single threshold crossing, Nobl9 evaluates burn rate across two windows simultaneously: a shorter window catches sharp spikes, and a longer one catches slow bleeds. Both conditions must be true for an alert to fire, which cuts noise without sacrificing sensitivity. The screenshot below shows exactly that: the alert triggered when burn rate exceeded 0.002x over 10 minutes and 0.001x over 5 minutes, confirming the degradation was real and sustained, not a momentary spike.
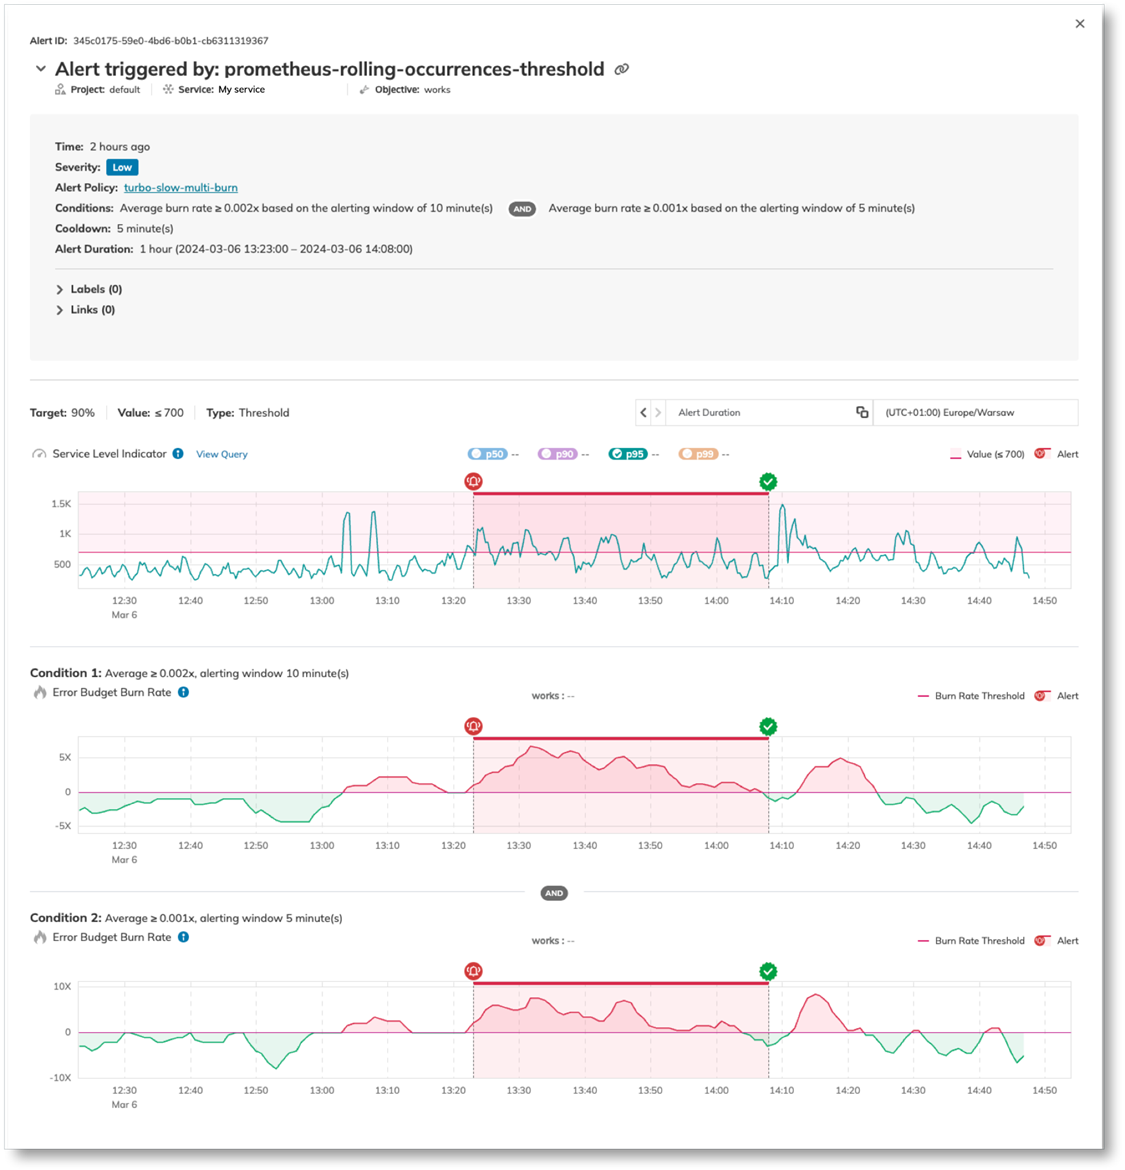
Multi-window, multi-burn alerting in Nobl9. Combining SLI charts with alert measurement data lets you see not just when an alert fired, but why the burn rate justified it. (source)
Implication
Error budget recovery trend tracks the trajectory of error budget consumption across quarters, sometimes years, to answer one question:
After disruption, does the service rebuild its reliability margin or settle into a permanently diminished state?
The difference shows up clearly during quarterly reviews:
|
Contained setback |
Drift |
|
|
Pattern |
One concentrated failure with stable recovery |
Repeated budget consumption, and the margin never rebuilds |
|
SLO status at quarter end |
Met |
Often met |
|
Trajectory |
Returning to baseline |
Gradually tightening |
Both services may technically meet their SLO at the end of a reporting window, but their risk profiles differ.
Dependency-driven incident impact
Services rely on shared databases, messaging systems, authentication providers, and third-party APIs, so they don’t fail on their own.
However, service-centric reporting creates a distorted picture. If a shared dependency experiences recurring strain, every consuming service shows SLO violations, and each team responds independently by:
- Adding retries and timeouts
- Introducing local caching
- Building circuit breakers around the unstable integration
These are reasonable local defenses, but they don't fully address the issue. The source of the problem remains intact, accountability fragments across teams, and the volatility persists.
Dependency-driven incident impact traces reliability degradation back to its origin across service boundaries. The question it tries to answer is: Which component's behavior actually pushed the service outside its reliability objective?
Nobl9's System Health Review aggregates SLO health across grouped services, enabling correlation of reliability degradation across teams that share infrastructure or use external providers. When several services fail together, the common dependency becomes difficult to ignore.
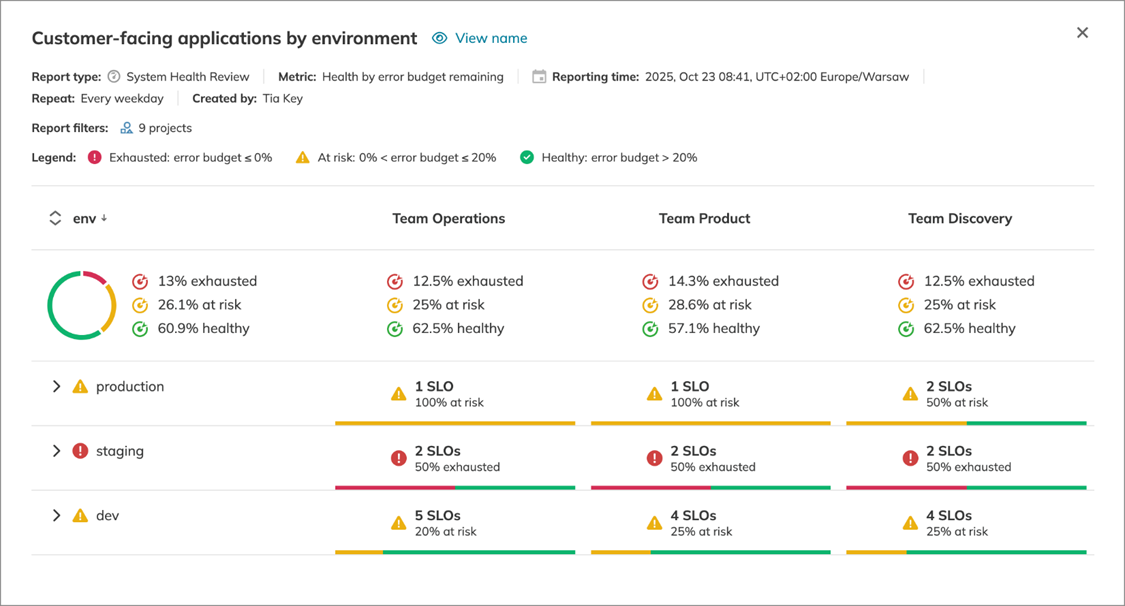
Nobl9's service grouping view. Correlating SLO health across grouped services surfaces shared dependencies that individual team reporting would miss. (source)
Implication
Dependency-driven incident impact visibility changes the tone of governance discussions. Instead of asking why one team's service is unstable, leadership can ask why a particular dependency consistently propagates risk.
That's a more useful question, and it leads to more durable interventions such as
- Isolating workloads
- Redesigning integration points
- Introducing redundancy
- Renegotiating third-party commitments.
These decisions sit at an architectural level and can't be resolved through faster incident response or local fixes.
The harder case is when the dependency is owned by a different organization entirely. It may have its own SLO, and that SLO may show green while downstream services burn budget, because the dependency's definition of healthy doesn't match what consumers actually need. A shared authentication service might meet its 99.9% availability target while its p99 latency quietly degrades, and every service that blocks on it absorbs that cost invisibly. This is where cross-team SLO alignment matters. Consumer services need visibility into upstream objectives, and those objectives need to be defined at the level of behavior that actually affects downstream reliability, not just the metrics the owning team finds convenient to measure.
Dependency analysis also surfaces concentration risk that steady-state metrics hide. A service can meet its SLO comfortably most of the time while remaining tightly coupled to a fragile upstream system. That exposure stays invisible until a larger failure makes it undeniable.
Navigate Chapters: