
-1.png)

Table of Contents
Like this article?
Subscribe to our Linkedin Newsletter to receive more educational content
Subscribe nowCustomer-Facing Reliability Powered by Service-Level Objectives
Service Availability Powered by Service-Level Objectives
Learn More
Integrate with your existing monitoring tools to create simple and composite SLOs

Rely on patented algorithms to calculate accurate and trustworthy SLOs

Fast forward historical data to define accurate SLOs and SLIs in minutes
Customer-Facing Reliability Powered by Service-Level Objectives
Service Availability Powered by Service-Level Objectives
Learn More
Drive response from SLO data
SLOs monitor and provide a target for service reliability. They also offer an ideal foundational input for automating appropriate responses to operational incidents. But what do we mean by incident response? The traditional incident response sequence is simply ‘alert, diagnosis, and resolution’, as shown on the left side of the diagram below.
In practice, traditional incident response workflows are typically broken into more granular stages, as shown on the right side of the diagram below.
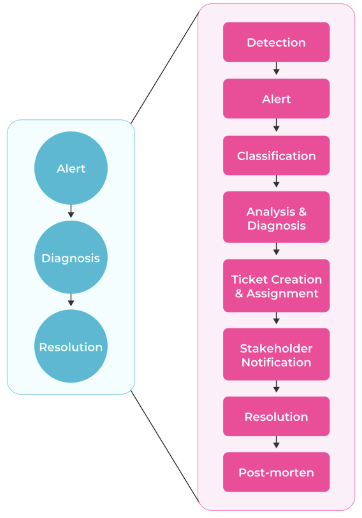
High-level and detailed incident response sequence.
This classic ‘people, processes, and tools’ workflow gave rise to the ITIL (Information Technology Infrastructure Library) and Google SRE (Site Reliability Engineering) methodologies, which attempt to standardize an organization's reaction function to planned and unplanned operational incidents.
This traditional workflow can and does go wrong. Given the number of steps, organizational groups, and handoffs, there is considerable room for error. Automation can reduce mistakes and help ensure predictable results.
So, what makes an SLO framework so well-suited as the feedback loop and driver for automation in responding to incidents? SLOs are designed and operated to specifically target reliability and possess key attributes relevant to incident response:
|
SLO characteristic |
SLO attributes and benefits |
SLO response example |
Precise and measurable |
SLOs provide a quantitative reflection of your system's health and reliability. |
The SLO targets 99.5% of requests to the backend product catalog microservice to have a latency less than or equal to 200ms as measured over a rolling 30-day window. |
|
SLO-driven automation has a clear goal: improve and restore reliability and performance, as observed through the customer experience lens. |
||
|
SLOs are the driver of the response: the “why” behind your automated response. |
||
User-focused |
SLOs are user-focused by nature. |
SLO measures the latency and response when retrieving products in the online store, as experienced by the customer |
|
SLOs are engineered to reflect the business and customer-facing perspective of your service. |
||
|
Alerts and automation focus on customer-impacting issues and not general background infrastructure noise |
||
Progressive scaling |
Error budgets and their policies define the urgency and level of intervention. |
SLO error budget alerting policy defines standard alert to the platform team at 50% error budget consumption, amber alert to the platform team & management at 75% and critical alert to all stakeholders at 90% budget consumption |
|
A change in the rate of error budget consumption indicates that a response is needed. |
||
|
Error budget policies can define increasing levels of escalation & response. |
||
Enterprise alignment |
An SLO is tied to user expectations of a business service or process, thus aligning with the needs of the enterprise. |
SLO dashboard and error budget consumption are visible throughout the organization to technical and business leaders |
|
SLO goals & performance are published across the enterprise and provide widespread visibility |
||
|
SLOs align technical teams and business leaders. |
The features and characteristics above demonstrate why SLOs provide the perfect platform for building an automated approach to incident response that includes AI-centric responses. SLOs specifically measure, monitor, and alert on reliability while focusing on what matters to the customer experience.
SLOs are the beating heart of your organization’s operational monitoring. They can both proactively and reactively drive your incident response. And, by using SLO error budgets, teams can implement them in a scaled, progressive, and controlled fashion.
Trigger responses from error budgets
SLO error budgets are key to the incident response process.
While SLOs provide the framework for reliability targets, error budgets trigger automated responses.
SLOs are defined with a business case, a detailed analysis of the user journey within your service, and a quantitative specification of the reliability objective. The SLODLC template examples for an SLO business case and an SLO specification provide practical examples.
The SLO specification includes the definition of an error budget. The error budget defines the acceptable level of service degradation before your service becomes non-compliant and breaches its SLO. For example, suppose your SLO dictates that 97% of online checkout transactions must complete within 2.5 seconds, as measured over a rolling 30-day period. In that case, your error budget is the number of transactions that exceed this threshold that your users are willing to tolerate. Said another way, error budget is the allowable failure rate. In this case, the error budget is 3% of transactions during the 30 days, e.g., 100% minus the 97% SLO.
This quantifiable tolerance for risk in an error budget can be consumed in different ways, at differing rates, and for various reasons. A key measure of error budget consumption is the “burn rate”, the rate at which the allowable failures are being ‘spent’ during the measurement window.
The error budget definition is accompanied by an error budget policy that defines the actions that should be taken in response to the consumption of an error budget or a change in the monitored burn rate. Importantly, this means that error budgets and their policies directly connect reliability with remediation activity.
SLOs represent the reliability and user experience of complex systems, and error budgets inform the automation when action is necessary: Error budget changes drive remediation and incident responses. (Source)
This allows organizations to closely monitor reliability, take action when reliability is at risk, and automate those actions while tying them into organizational policy and processes.
To summarize:
- Error budgets define when action is needed, how urgently, and of what type
- Error budget policies define the specific actions to take
- Error budget policies also document the automated response mechanisms
Error budget policies allow a fine-grained approach to alerting and escalation. Platform teams can define appropriate levels of alerting and escalation based on the rate of error budget consumption, the service's criticality, and the impact of any potential service outage.
Given the highly configurable nature of alerting and incident response automation, error budget policies are crucial for documenting automated responses, which can become complex over time.
Error budgets can also be defined in code, making them easy to socialize and an integral part of infrastructure-as-code and routine CI/CD deployments for regular fine-tuning.
For example, Nobl9 allows you to combine slow and fast burn alerts to ensure that a small amount of unreliability that is not sustained will not alert, significantly reducing false positives. This can be achieved using multi-window, multi-burn alerting. These can be defined as a Nobl9 YAML AlertPolicy in code as shown below:
- apiVersion: n9/v1alpha
  kind: AlertPolicy
  metadata:
    name: fast-burn
    project: default
  spec:
    alertMethods: []
    conditions:
    - alertingWindow: 15m
      measurement: averageBurnRate
      op: gte
      value: 5
    - alertingWindow: 6h
      measurement: averageBurnRate
      op: gte
      value: 2
    coolDown: 5m
    description: "Multiwindow, multi-burn policy that triggers when your service requires attention and prevents from alerting when you're currently recovering budget"
    severity: Medium
Nobl9 multi-window, multi-burn AlertPolicy defined in code
An AlertPolicy can be combined with an AlertMethod to define where alerts are raised:
apiVersion: n9/v1alpha
kind: AlertMethod
metadata:
  name: servicenow
  displayName: ServiceNow Alert Method
  project: default
  annotations:
    area: latency
    env: prod
    region: us
    team: sales
spec:
  description: Example ServiceNow Alert Method
  servicenow:
    username: user
    password: super-strong-password
    instanceName: vm123
    sendResolution:
      message: Alert is now resolved
In summary, SLO error budgets and their policies:
- Are progressive, highly configurable, and can be defined in code
- Integrate seamlessly with standard alerting tools and incident ticket tooling
- Are published and shared throughout the organization
- Reflect the actual customer impact of an outage or service degradation
- Bring observability, monitoring, and notification together
Implement scoped and documented automated responses
With an SLO reliability framework that integrates observability, monitoring, and notification, you can then implement automated responses to alerts and incidents.
Principles and rationale
The automation that responds to alerts will grow in sophistication, value, and complexity over time and will therefore require three continual implementation approaches during the iterative development process:
- Automated responses should be scoped with limits applied
- All automated response actions should be fully logged and audited
- The automation logic and mechanisms should be well-documented
We can go one step further at this planning stage and summarize essential principles and a supporting rationale to help guide the development of the automated responses:
|
Principle for developing automated responses |
Detailed description |
|
Build confidence |
Build confidence in your detection accuracy by instrumenting responses with detailed telemetry, tracking the effectiveness of your responses, and ensuring that the automation is deterministic and scoped. |
|
Focus on business value |
Use SLOs & SLO incident history to guide where to focus for the most business value. |
|
Document for continual improvement |
Document automated responses as part of the SLO specification and error budget policies, including trigger conditions, expected outcomes, and escalation procedures to serve as operational guidance and input for improving automation logic. |
Progressive approach to implementation
Teams should implement a progressive approach to iteratively automating more and more of the incident response workflow:
- Start small, monitor closely, and iterate
- Solutions must always integrate ‘people, processes, and tools’
- Solutions should directly address customer impact
- Automate the well-understood processes first
- Implement progressive improvements and sophistication in responses
Using a progressive approach, teams can target increasing levels of sophistication in automated responses with SLOs. This is illustrated in the table below.
| Automated incident response sophistication level | Summary of sophistication level capabilities |
| Level 1 |
|
| Level 2 |
|
| Level 3 |
|
The automated responses can start initially with simple detection, assessment, and alerting. Initial alerts can be sent to operations teams, including relevant telemetry and aggregation of logging data. If error burn rates continue or increase, alert policies can be used to implement escalating levels of alerting and notification, informing additional teams or stakeholders as necessary.
Teams can advance from basic alerting and notifications to error budget events that trigger remediation actions. These can consist of scripts, Ansible playbooks, infrastructure provisioning, or complete CI/CD automation pipelines with built-in verification.
Examples
One scenario for an automated response is to provision new infrastructure. In the event of Kubernetes capacity or connectivity issues, Terraform code could be triggered under certain SLO alert conditions to provision new standby infrastructure. See below for a sample code snippet deploying a failover Kubernetes AWS EKS cluster and Node Group:
# Create Kubernetes control plane and worker nodes
resource "aws_eks_cluster" "failover_cluster" {
  name     = "failover-online-store-cluster"
  role_arn = aws_iam_role.failover_eks_cluster_role.arn
}

resource "aws_eks_node_group" "failover_node_group" {
  cluster_name    = aws_eks_cluster.failover_cluster.name
  node_group_name = "failover-app-workers"
  node_role_arn   = aws_iam_role.failover_eks_node_role.arn

  scaling_config {
    desired_size = 2
    max_size     = 3
    min_size     = 1
  }
}
Sample Terraform code deploying a standby Kubernetes cluster and node group in AWS
Similarly, Ansible playbooks could be used to run diagnostic scripts before deciding the optimal remediation actions, e.g., replacing instances, scaling up capacity, rolling back recent changes, or similar:
# Create Kubernetes control plane and worker nodes
resource "aws_eks_cluster" "failover_cluster" {
  name     = "failover-online-store-cluster"
  role_arn = aws_iam_role.failover_eks_cluster_role.arn
}

resource "aws_eks_node_group" "failover_node_group" {
  cluster_name    = aws_eks_cluster.failover_cluster.name
  node_group_name = "failover-app-workers"
  node_role_arn   = aws_iam_role.failover_eks_node_role.arn

  scaling_config {
    desired_size = 2
    max_size     = 3
    min_size     = 1
  }
}
Example: Ansible playbook running a diagnostic script to determine subsequent actions
Once teams develop a range of diagnostic and remediation steps for various known issues, engineers can combine them into more intelligent and adaptable end-to-end workflows to achieve a high level of automation.
To illustrate this, consider your SLO platform raising an incident that triggers a CI/CD workflow that chains your logic together by calling different shared workflows depending on the type of incident and the initial diagnostic findings. Such a workflow could investigate, remediate, verify, and finally manage the incident's closure. See below for a simple illustration of this in GitHub Actions:
name: Automated Remediation Workflow

on:
  workflow_call:
    inputs:
      INCIDENT_TICKET_NUMBER:
        description: 'Incident ticket number for tracking'
      PLATFORM_MASTER_NODE:
        description: 'Master node for platform'
    secrets:
      ssh_key: $

jobs:
  DIAGNOSE:
    uses: ./.github/workflows/error-budget-diagnose.yml
    with:
      INCIDENT_TICKET_NUMBER: $
      PLATFORM_MASTER_NODE: $
    secrets:
      SSH_KEY: $

  REMEDIATE:
    needs: DIAGNOSE
    uses: ./.github/workflows/error-budget-remediate.yml
    with:
      PLATFORM_MASTER_NODE: $

      SVC_IN_ERROR: $
    secrets:
      SSH_KEY: $

  RESOLVE_AND_CLOSE:
    needs: REMEDIATE
    uses: ./.github/workflows/error-budget-closure.yml
    with:
      INCIDENT_TICKET_NUMBER: $
      SVC_IN_ERROR: $
    secrets:
      SSH_KEY: $
Example: GitHub Action workflow that remediates and resolves a reported incident
Scoping and documentation
When implementing automated responses, teams should ensure that they are scoped to only affect change on systems that impact the customer experience and limit those changes to the precise level of change required to restore service.
In addition, all automated responses and changes should be logged for later auditing and root cause analysis. The SLO error budget policy should also document the automated response logic to ensure it remains supportable and extensible.
AI is now offering teams new opportunities to handle the complexity of diagnosis and remediation. Still, the same key principles apply - it should be scoped, limited, and clearly understood, as discussed in the next section.
Leverage predictive analytics
Artificial Intelligence (AI) in operations, also known as AIOps, provides new approaches to help teams analyze vast amounts of incident-related data and potentially automate remediation activities.
The primary benefits of AIOps currently lie in the following areas:
- Anomaly detection: intelligent detection of unusual patterns (using unsupervised machine learning) before they escalate
- Predictive analytics: using historical or recent data to forecast potential incidents, capacity needs, or performance degradation
- Root cause analysis: conducting correlation and noise reduction using multiple data sources (logs, traces, metrics) for rapid RCA conclusions
As shown below, SLO platforms can bring these capabilities to your incident response processes. Platforms such as Nobl9 support integrations with all major observability solutions, cloud providers, and notification systems.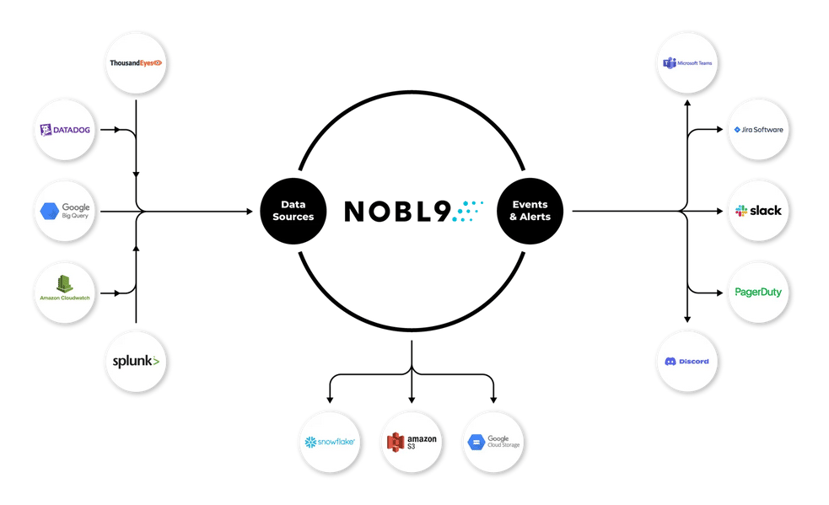
Nobl9 integrations with observability sources, alerting tools, and cloud providers. (Source)
Anomaly detection
Anomaly detection works best when integrated into your SLO framework to benefit from error budget and notification configurations.
The flow for introducing anomaly detection on your own data would look like this:
- Train a time series model to learn the specific trends of your data
- Let the model highlight new data points that deviate from its learned baseline
- Send these instances to your SLO platform as events that burn an error budget
Google BigQuery ML is a good example of this workflow. BigQuery ML provides two models, or pipelines, for time series data that offer anomaly detection: ARIMA_PLUS and ARIMA_PLUS_XREG (for univariate and multivariate models, respectively).
To illustrate how this could work, let’s assume you have time series data in a BigQuery table called slo_checkout_metrics.table:
timestamp                             service_name         metric_nm    metric_val
2025-09-01 10:00:00 UTC    checkout-service   latency_ms    120.5
2025-09-01 10:01:00 UTC     checkout-service   latency_ms    118.2
2025-09-01 10:00:00 UTC    payment-service    latency_ms    85.1
2025-09-01 10:01:00 UTC     payment-service    latency_ms    88.9
A simple SQL query can then train an anomaly detector model on your proprietary data. This way, the model learns what is ‘normal’ for your environment.
Let’s create an anomaly detector model using the time series ARIMA_PLUS model:
CREATE OR REPLACE MODEL `slo_checkout_latency_anomaly_detector`
OPTIONS(
  model_type = 'ARIMA_PLUS',
  time_series_timestamp_col = 'timestamp',
  time_series_data_col = 'metric_value',
  time_series_id_col = 'service_name',
  auto_arima_max_order = 5,
  holiday_region = 'US',
  detect_anomaly = TRUE –- IMPORTANT!
) AS
SELECT
  timestamp,
  service_name,
  metric_value
FROM
  `slo_checkout_metrics.table`
WHERE
  metric_name = 'latency_ms';
Note the detect_anomaly = TRUE option, which will automatically configure the model to identify anomalies, based on probability, given the historical training pattern.
In addition, the ARIMA_PLUS model, actually a pipeline of models, will automatically:
- Infer the data frequency of the time series
- Handle irregular time intervals
- Handle duplicated timestamps by taking the mean value
- Interpolate missing data using local linear interpolation
- Detect and clean spike and dip outliers
- Detect and adjust abrupt step (level) changes
- Detect and adjust holiday effects
- Detect multiple seasonal patterns within a single time series
- Detect and model the trend for automatic hyperparameter tuning
Once the model has been trained, you can apply the model using the ML.DETECT_ANOMALIES function to analyze new incoming metric data. This is where new data will be compared to the model’s learned patterns.
A scheduled query could be defined to check for anomalies every 5 minutes:
-- Finds anomalies in the last hour's data
SELECT
  *
FROM
  ML.DETECT_ANOMALIES(
    MODEL `slo_checkout_latency_anomaly_detector`,
    TABLE `slo_checkout_metrics.table`,
    STRUCT(0.95 AS anomaly_prob_threshold) -- Sensitivity level
  )
WHERE
  is_anomaly = TRUE
  AND timestamp >= TIMESTAMP_SUB(CURRENT_TIMESTAMP(), INTERVAL 1 HOUR);
If anomalies are detected, the scheduled query above could trigger a Google Cloud Function or similar and send the anomaly details to your SLO platform. This could be done via an API call containing the details of the anomaly, e.g., service name, timestamp, and anomalous metric value. This anomaly would then directly burn the error budget related to the SLO.
This illustrates how a machine learning model, trained on your own proprietary data, can leverage SLO error budget alerting against dynamic thresholds to highlight anomalous system behaviour.
Root cause analysis
Determining cause and effect can be challenging for alerts from complex systems. AIOps solutions also offer the ability to correlate issues from multiple data sources (logs, traces, and metrics), apply noise reduction filtering, and potentially enable rapid RCA conclusions.
To illustrate this, consider an example workflow in AWS:
- Unify logs, metrics, and traces in an observability lake
- Monitor data for anomalies
- Use historical observability data to train machine learning models
- Perform root cause analysis across logs, metrics, and traces
- Send alerts and SLO-aware RCA reports to your SLO platform
Different AWS services can be combined to achieve this:
| Application and RCA use-case | AWS services |
| Data ingestion and unification | Amazon CloudWatch, AWS X-Ray, and S3 with AWS Glue Data Catalog |
| Anomaly detection | CloudWatch Anomaly Detection and Amazon Lookout for Metrics |
| Machine learning model generation | Amazon Sagemaker |
| RCA automation engine | Amazon EventBridge, AWS Step Functions, and SLO platform API integration |
Navigate Chapters: