
-1.png)


As we start the new year, we wanted to take a moment to reflect upon what we’ve learned in 2023, and maybe it will inspire you to apply new techniques to your release management. Many big changes came our way in 2023, such as launching the Nobl9 Reliability Center, SLI Analyzer, Azure Monitor integration, and introducing innovative reporting like the Reliability Score and Drill Down. While these “bigger fish” features have made more headlines, I’d like to highlight the small, iterative changes that significantly enhance the user experience.
Though the primary focus of our product is SLOs, we realize that solely concentrating on them isn’t enough to deliver the best possible customer experience. That’s why we incorporate continuous deployment into our software development process, resulting in subtle yet impactful improvements throughout our platform. In an engineering landscape full of trade-offs, it's about striking the balance between significant advancements and those nuanced touch-ups that elevate our offerings. These improvements also have the potential to positively impact internal SLOs when prioritized and planned against other tech debt initiatives. It also proves that SLOs can be an extremely valuable tool for release management.
Throughout the year, our product has undergone numerous improvements, with the most significant strides occurring in the accuracy of data processing and resilience of the techniques we use for data collection. Additionally, we've rolled out innovative approaches to visualizing data and implemented reporting enhancements such as the Reliability Score.
Data accuracy and resilience
In my previous blog from May, I emphasized our ongoing commitment to enhancing our product and highlighting reliability and software quality as a crucial part of the user experience. This dedication remains strong today, particularly as precise calculations that underpin reliability monitoring are at the core of our product. With this context in mind, let's explore one of the areas we’ve improved - the intricacies surrounding data availability and density.
One of the examples is ratio-based SLOs and the potential impact of API call discrepancies on error budget calculations. An API call is usually needed to pull each data stream from the source. In rare cases, however, an API call might fail to deliver a metric or provide the metric with a delay, resulting in inaccurate error budget calculations. Before, these inaccuracies had resulted in error budgets that were reported at more than 100%, which is impossible unless there’s an error in the source data. That’s why we've introduced important optimizations to make such calculations more resilient to missing or delayed data points. Nobl9 can now sift through these API failures and accurately represent reliability without worrying that missing data will skew the result. (Read more in the Nobl9 guide on SLO calculations)
Handling sparse metrics within the Occurrences budgeting method is another example. While Nobl9 typically anticipates data points every minute, there are situations where these points occur less frequently. In such cases, error budgets might not be calculated, and SLO diagrams show “no data” information errors. In such cases, we've resolved calculation and presentation issues, providing insights when data points occur less frequently than once per minute. Now, there are no constraints except logical limits based on the SLO calculation window.
Improved data comprehension through visualization
While having access to reliable data is crucial, insights on this data are hard to weed out without effective visualization. Continuously enhancing the data's presentation remains a priority so you can effortlessly read and report on your system’s reliability.
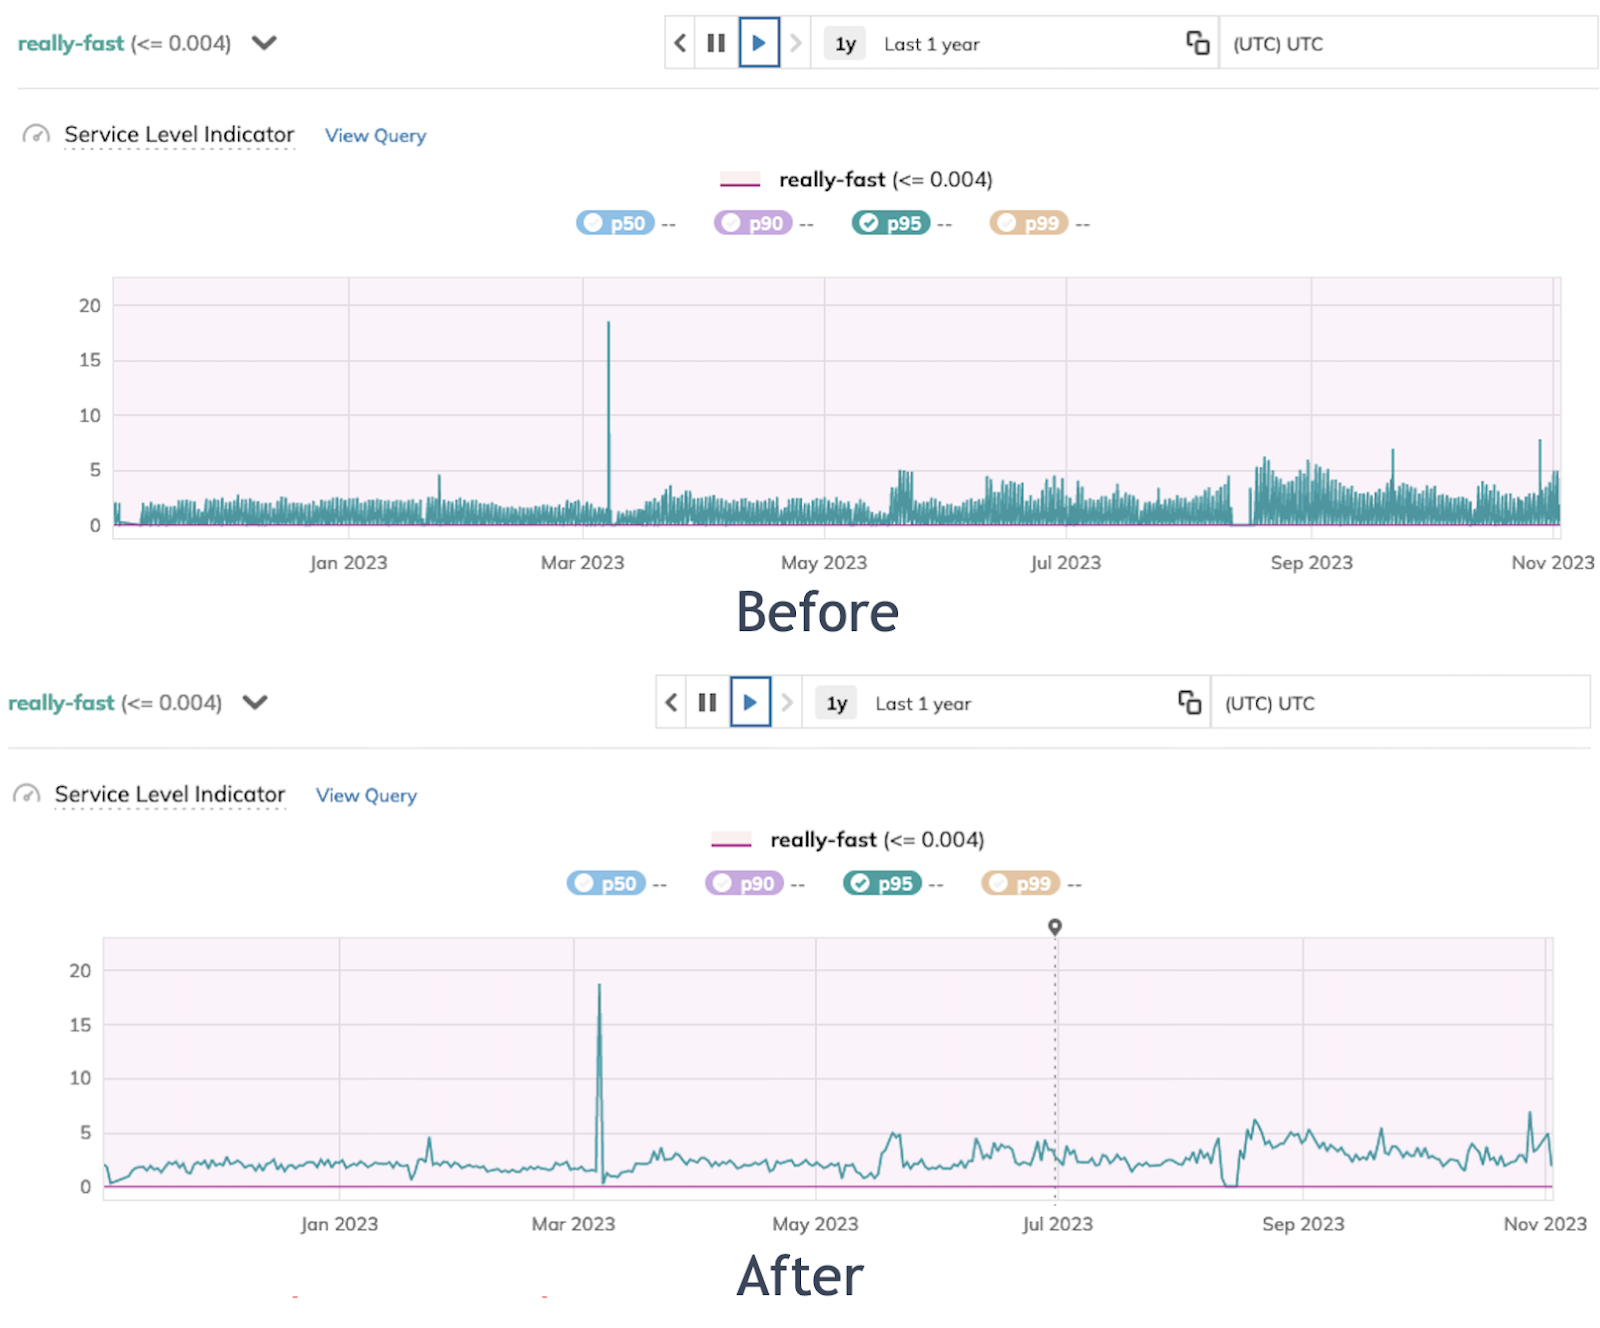
To further refine our presentation, Nobl9 now shows aggregated data points in charts to enhance clarity, especially for extended time windows. This view can help you grasp how data (SLIs) is distributed when looking at the chart over an extended time frame. However, you can still access the raw data by zooming in. This change allows you to see holistic time windows while keeping the ability to drill down into specific data points. Refer to the image below for a visual representation of this change.
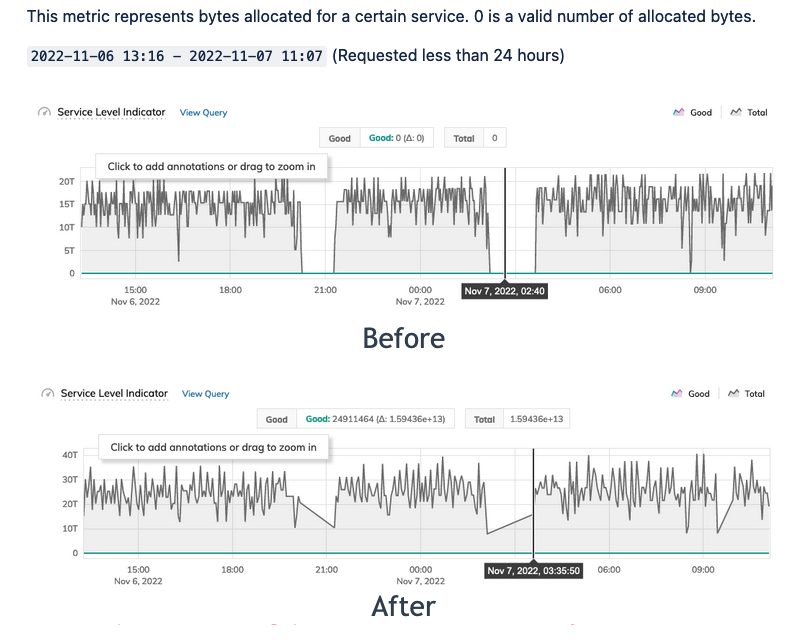
Furthermore, we've changed how data gaps look on SLI charts. Previously, Nobl9 inserted artificial data points set at 0 to denote gaps in count metric data for visualization purposes. Our recent updates allow you to quickly identify and annotate periods on the SLI charts where your count metric SLOs did not record any data. Refer to the image below for a visual representation of this change.
Turning to SLI Analyzer, we’ve shifted to population-based methods for calculating standard deviation and variation. Using population-based methods allows you to analyze much larger data sets, furthering the insights you receive before setting up SLOs. Before, we used sample-based calculations suited more for individual samples rather than analyzing entire datasets. With this change, you can more comprehensively and accurately represent the overall reliability.
All these improvements help you better understand your data and extract even more value from your SLOs.
Mature reporting
One of the key elements of Nobl9’s mission is fostering collaboration among various organizational roles and teams like engineering, operations, and management through a common language that both business and technical stakeholders can communicate. As it’s always been, the common language to this notion is still SLOs. However, the overall impact is broader and holistic, impacting software quality and reliability. With this mission in mind, we pivoted and released the Reliability Center and added reporting methods that are more relevant and shared among all stakeholders. We aim to offer the most effective and adaptable strategies for dissecting and presenting reliability insights.
You can now check out historical time ranges and create reports on specific custom timeframes. These changes mean you have more freedom and control when creating reports and don't need the old template-based system. The updated reports are easier to use, with options to customize structures, views, and names. You can also access more report types and share them more easily. This update is a step toward a more practical and adaptable reporting system, letting users dig deeper into their system's reliability data.
While the big ticket releases garner the most attention and should be praised, the value of small iterative improvements adds up in the long run and should not be overlooked. Furthermore, small changes are less likely to cause big incidents and downtime, making them much safer. Iteration is the key to agile software development, resulting in our ability to satisfy our customers' wants and needs with a quick turnaround. By dogfooding our product, we can consistently stay on top of our release management and testing using SLOs.
While SLOs remain the core of our platform, we're committed to continuously incorporating features that streamline and enhance users' experiences of assessing the health of their infrastructure. By consistently refining even the tiniest aspects, Nobl9 evolves and grows better with time. This approach isn't just about refining the software; it's about creating an environment where new ideas and improvements flourish.
If you want to learn more about the Nobl9 software development cycle, we're always around to help. If you were so inspired by this blog that you've decided SLOs are for you, we have a free edition of our product for you to test out!
Share:


Do you want to add something? Leave a comment