
-1.png)


“I want to set service level objectives, but where do I start? And how do I know what the SLO should be?”
We hear these questions a lot. But by using Nobl9 Reliability Center’s new integration with Azure Monitor, you can have useful SLOs in three simple steps. Just Connect, Browse, and Analyze; no guessing required.
This new integration is one of our most robust data source integrations yet and will create a new way for Azure Monitoring users to use their data.
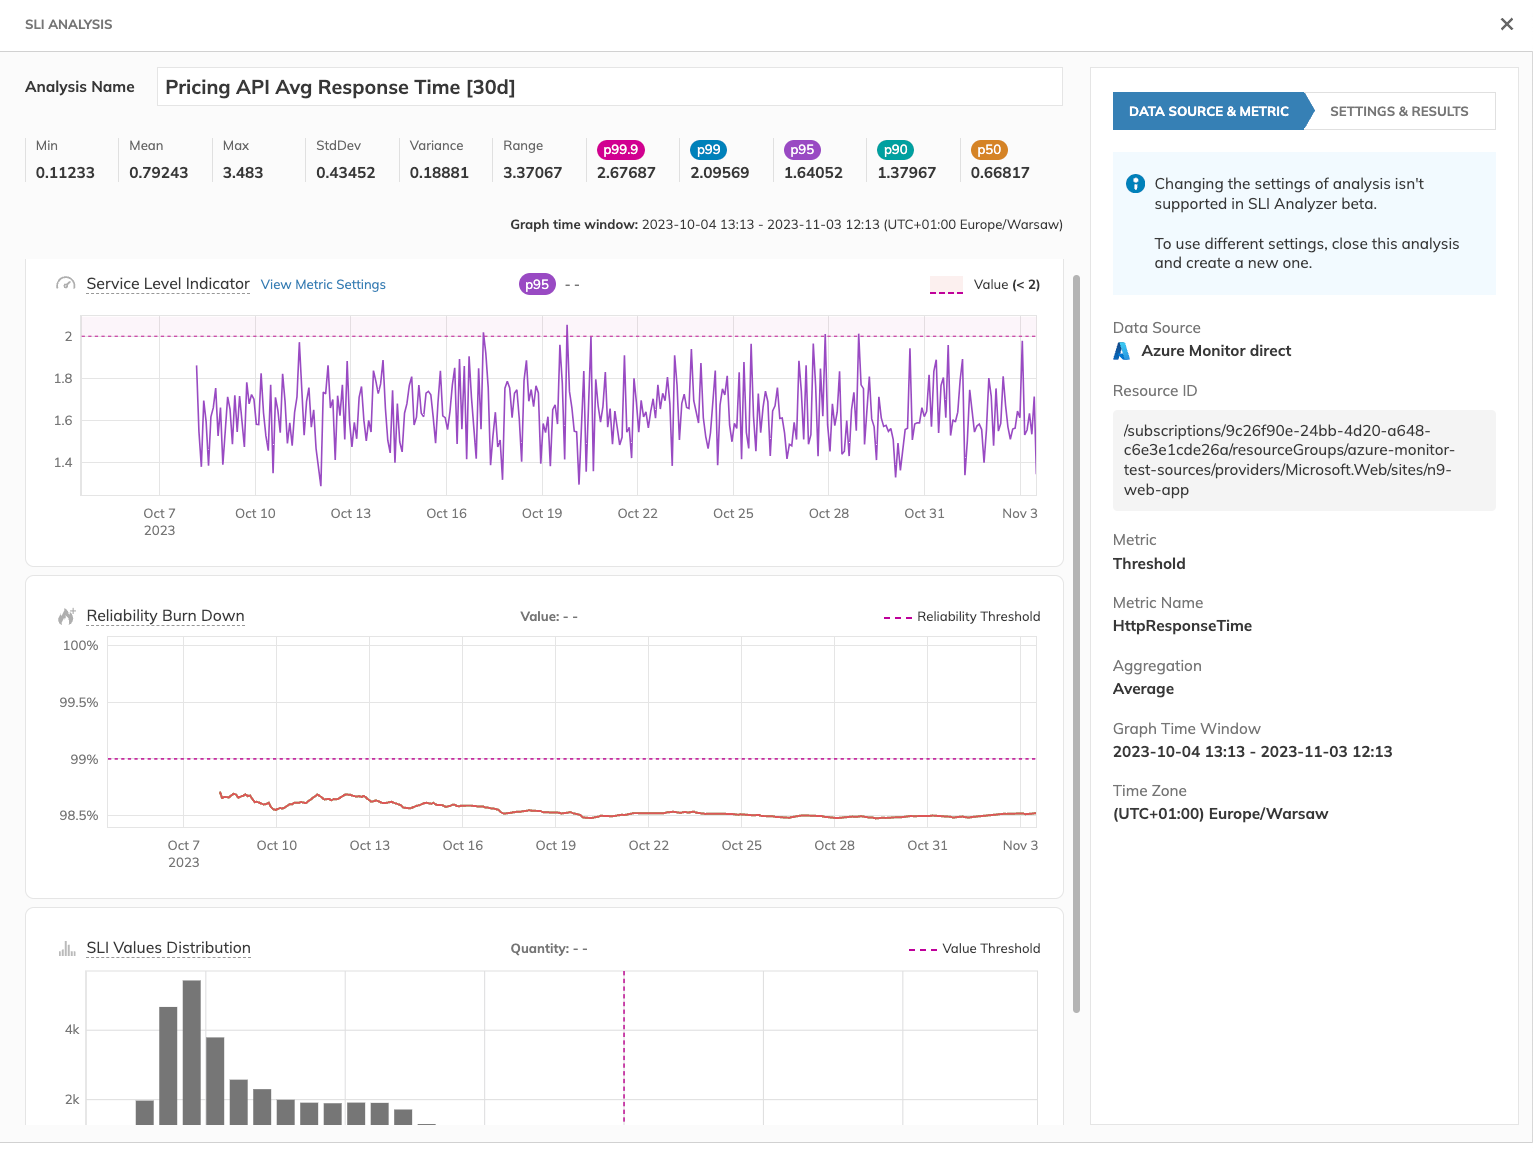
Azure Monitor users can now use Nobl9’s service level indicator analyzer (SLI Analyzer) to create SLOs immediately from existing Azure monitoring data. There is no more guesswork in where to set the goal or threshold of the SLO.
Azure Monitor is a fully integrated solution designed for Microsoft Azure clients, offering an extensive suite of tools to facilitate the aggregation, organization, and management of metrics data and logs. This service provides a robust framework for monitoring applications, services, and infrastructure across cloud environments and on-premise resources.
The new Nobl9 Reliability Center integration lets you connect your Azure Monitor Metrics data and create service-level indicators using your existing and continuously expanding data collection. You can utilize Azure Platform Metrics, Application Insights Metrics, and Custom metrics that you push to Azure Monitor. Now, you can quickly set goals without guessing and better manage and respond to reliability concerns.
Setting Up The Data Connection
After you set up our Agent or Direct connection, Nobl9 can pull your Metrics data immediately after they become available in Azure Monitor.
We also support importing up to 30 days of historical data for your Service Level Objectives and performing data analytics using Nobl9’s SLI Analyzer. Azure Monitor users can use existing data to automatically create SLOs without the guesswork of predicting a meaningful threshold or goal for their SLO.
Defining SLOs-as-Code, Reliability Engineering the GitOps Way
As with any data sources Nobl9 supports, you can define your indicator and objectives using YAML and apply them to the platform using our sloctl command line tool. It allows you to treat all the objects defined in the Nobl9 system as code artifacts - version them, and build CI/CD pipelines around them. Using SLOs as Code, you can automate your software delivery process and avoid manual errors. In addition, SLOs give you an added layer of insights to better understand when to work on feature delivery or technical debt.
- apiVersion: n9/v1alpha
kind: SLO
metadata:
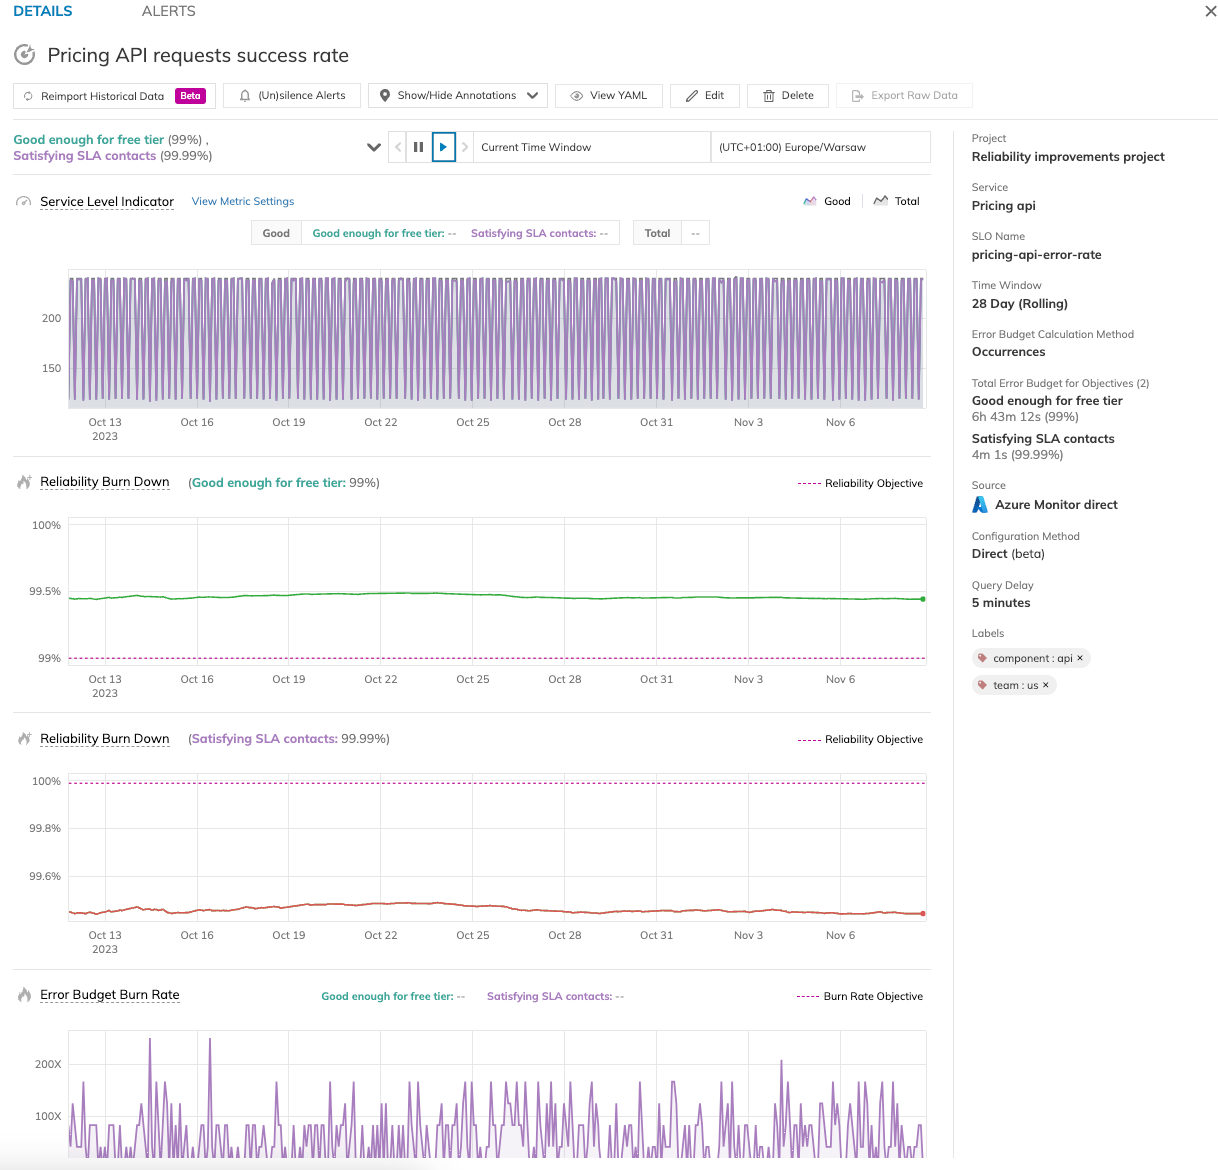
displayName: Pricing API requests success rate
name: pricing-api-error-rate
project: reliability-improvements
spec:
budgetingMethod: Occurrences
indicator:
metricSource:
kind: Direct
name: azure-monitor-direct
project: reliability-improvements
objectives:
- countMetrics:
good:
azureMonitor:
aggregation: Count
metricName: Http2xx
resourceId: /subscriptions/9c26f90e-24bb-4d20-a648-c6e3e1cde26a/resourceGroups/azure-monitor-test-sources/providers/Microsoft.Web/sites/n9-web-app
incremental: false
total:
azureMonitor:
aggregation: Count
metricName: Requests
resourceId: /subscriptions/9c26f90e-24bb-4d20-a648-c6e3e1cde26a/resourceGroups/azure-monitor-test-sources/providers/Microsoft.Web/sites/n9-web-app
displayName: Good enough for internal users
name: good-enough-for-internal-usage
target: 0.95
timeWindows:
- count: 28
isRolling: true
period:
begin: "2023-10-11T15:28:36Z"
end: "2023-11-08T15:28:36Z"
unit: Day
It looks at the ratio of successful Http2xx to all Request metrics and sets a reliability target of 95%.
As you may notice, the YAML snippet references specific Azure resources by using Azure Resource Identifiers (for example/subscriptions/9c26f90e-24bb-4d20-a648-c6e3e1cde26a/resourceGroups/azure-monitor-test-sources/providers/Microsoft.Web/sites/n9-web-app).
Obtaining resource identifiers from the Azure Portal or Azure CLI and and putting them in a YAML file can be an error prone operation.
That’s why we implemented Azure Monitor Resources and Metrics Discovery.
Browse Resources and Metrics
The Nobl9 integration with Azure Monitor is the first integration in our inventory that supports the discovery of clients' resources and metrics. Once you set up an Azure Monitor data source, you don't need to remember or copy/paste any specific resource identifier or metric name. You can easily explore all resources and their metrics within the Nobl9 web application. Besides pulling data, they can run data source metadata queries on demand with minimal latency. So now you can quickly connect, browse, analyze, and have useful SLOs in minutes instead of repetitive trial and error.
Connect, Browse, Analyze
We hope you like it. You can use Nobl9 Free Edition with Azure Monitor and start today at nobl9.com/signup.
Share:


Do you want to add something? Leave a comment