
-1.png)

Table of Contents
Like this article?
Subscribe to our Linkedin Newsletter to receive more educational content
Subscribe nowCustomer-Facing Reliability Powered by Service-Level Objectives
Service Availability Powered by Service-Level Objectives
Learn More
Integrate with your existing monitoring tools to create simple and composite SLOs

Rely on patented algorithms to calculate accurate and trustworthy SLOs

Fast forward historical data to define accurate SLOs and SLIs in minutes
Metrics
Metrics are important in monitoring as they provide visibility into individual service behaviors and overall system performance. Metrics are represented as numbers; they are numerical values measured over a period of time that indicate a specific measurement of a service or system's health.

A metric must include a metric name, value, and timestamp.
Types of metrics in microservices
|
Type |
What the metrics do |
Examples |
|
Service metrics |
Measure the performance of individual microservices and how each service can handle the traffic. |
|
|
Infrastructure metrics |
Monitor system resources on which the microservices are executing. |
|
|
Business metrics |
Identify how the performance of microservices impacts business goals. |
|
|
Dependency metrics |
Track how microservices interact with each other or with third-party external services. |
|
|
Database metrics |
Detect the performance of databases that could impact system performance. |
|
Logs
Logs can be in a structured or unstructured format. They are streams of timestamped records describing what happened in your system and when. They provide insights into unpredictable behavior in microservices by logging events, transactions, errors, warnings, and user interactions. They are typically used for debugging, troubleshooting issues, auditing activity, and analyzing system behavior, especially in the case of incidents.
A typical log entry might look like:
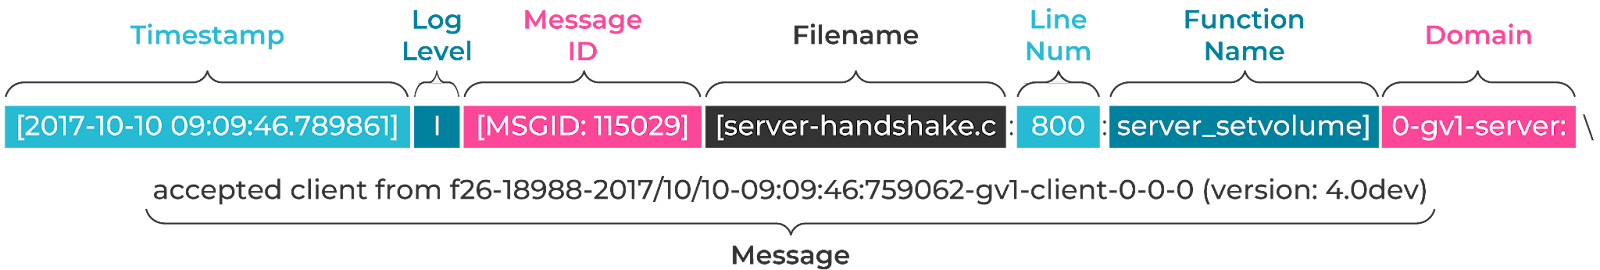
A structured log sample (source)
Logs can be categorized according to their format into:
- Plaintext logs: Human-readable strings are the most widely used format due to their simplicity.
- Structured logs: These contain key-value pairs or JSON data and are rich in metadata and more straightforward to parse and query.
- Binary logs: These are sets of compact, encoded records optimized for performance and storage. They require specific reading and analysis tools.
Types of logs in microservices
|
Log type |
What the logs do |
Examples |
|
Application logs |
Track the performance and events within an application |
|
|
System logs |
Track the events and resource utilization for the hosting operating system |
|
|
Network logs |
Record the network activity and the traffic flow and detect the connectivity issues |
|
|
Security logs |
Track the user session activity and detect suspicious behaviors |
|
Log aggregation in microservices
Logging is essential in troubleshooting, but it's not simple in microservices architecture since the logs are distributed among different services, each writing to its own log files. Log aggregation overcomes this problem by consolidating all the logs of all services into a unified logging system like Elasticsearch, Splunk, Datadog, or New Relic. This logging system is responsible for collecting, aggregating, and storing the logs, and from this logging system, teams can search, graph, and analyze the logs.
For example, within an ecommerce application built using microservices—such as payment, inventory, and shipping—every service has its own logs. Without aggregation, identifying a problem like a failed order would require accessing the logs on different servers. However, with aggregation, all correlated logs can be queried centrally, like by order ID, so the root cause analysis is much easier.
Log aggregation pipeline
All log aggregation pipelines consist of three major components:
- Source: Logs are generated from different sources; those sources can be applications, infrastructure, or networks. Logging agents such as Fluentd, Logstash, or Alloy, collect the logs and ship them to the centralized logging system.
- Storage: The centralized logging system indexes and stores logs for search and analysis. This could be a file system, a database, or a cloud service. Logging tools like Splunk and Elasticsearch have high write throughput and rapid querying, and they usually have SDKs to extract meaningful information from large-volume logs.
- Consumer: Logs are consumed by several systems and tools, such as Kibana, Grafana, and PagerDuty, to enable the developers and operations teams to use their web UIs for debugging and to check the alerts for errors.

Traces and distributed tracing
Traces are essential because they provide insight into the journey of a request from one service to another. Each request is assigned a unique trace ID, which allows the tracing of the request's path through all services and their child calls. This, in turn, helps the team identify performance bottlenecks and root causes more quickly.
Tracing breaks down a request into spans. Each span represents a unit of work done by the service and captures key metadata like operation names, timestamps, and identifiers.
For example, suppose that in an ecommerce application based on microservices—e.g., inventory service, shopping cart, payment service, and order confirmation—a customer reports a slow checkout process that leads to an abandoned cart. The checkout flow involves several services, each handling a part of the request independently, making it hard to find where the delay happened.
With distributed tracing, each request has its unique trace ID that flows through all services, and each request is broken into spans. By analyzing those traces and spans, the team can detect the root cause of the delay, such as by finding that the request was fast through the inventory and payment services but slow during order confirmation.

An order workflow in an ecommerce application showing the included traces and spans.
There are three types of tracing, summarized in the table below.
|
Tracing type |
What the tracing does |
Use case |
|
Code tracing |
Manual simulation of how code processes data line by line |
Debugging and analyzing application logic based on source code. |
|
Program tracing |
Observing application behavior during execution by injecting and tracking input |
Monitoring overall app behavior; obtaining runtime-level insights. |
|
End-to-end tracing |
Tracking requests as they pass through a distributed system (also known as distributed tracing) |
Understanding the request flow across different services in a microservices application. |
There are two methods to instrument an application for distributed tracing: manual and automatic
Manual instrumentation
This is a way to implement distributed tracing by adding specific snippets into the application code to collect and send the telemetry data. It gives complete control over data collection and reporting, which is helpful for applications with specific observability needs. It does take time and effort to implement.
For example, a developer can instrument a Java service with the OpenTelemetry SDK to create spans around specific business logic, such as wrapping a span around the checkout() function to measure the time it takes to complete a purchase.
This snippet creates a custom span around the checkout() function. It manually tracks execution time and errors for detailed tracing.
const { trace } = require('@opentelemetry/api');
const tracer = trace.getTracer('checkout-service');

async function checkout(userId) {
  const span = tracer.startSpan('checkout-operation');
  try {
    // Business logic here
  } catch (err) {
    span.recordException(err);
    throw err;
  } finally {
    span.end();
  }
}
Automatic instrumentation
This is a simple way to configure tracing. It involves adding an agent or an SDK to your application without modifying your application code. It is less customizable than manual instrumentation, but it is far simpler and quicker to configure.
For example, a developer can use the OpenTelemetry auto-instrumentation agent for Java by attaching it to the JVM. This agent automatically traces popular libraries like Spring, JDBC, and HTTP clients without changing the application code.
This command starts the app with an agent that auto-instruments libraries without touching the source code:
java -javaagent:opentelemetry-javaagent.jar -jar your-app.jar
Customer-Facing Reliability Powered by Service-Level Objectives
Service Availability Powered by Service-Level Objectives
Learn More
Service-level objectives (SLO)
Maintaining reliability and meeting performance targets is critical in distributed systems with multiple dependencies, like microservices applications. This is why service- level objectives (SLOs) are important.
SLOs are predefined targets, often expressed in percentages, that indicate the system’s reliability and performance over a specified period. They allow teams to evaluate how well the services meet their goals and lead to user satisfaction.
SLOs transform collected telemetry data into actionable targets, bridging the gap between metrics and reliability by defining measurable goals that track what matters most, such as response times, error rates, and availability. That's how monitoring and SLOs together create a complete reliability strategy. As monitoring tools like Prometheus, Datadog, or Dynatrace gather the essential data, SLOs provide the framework for understanding and improving system performance.
For example, Nobl9, a SaaS SLO management platform, helps apply this strategy by integrating with different monitoring systems and then establishing SLOs in a consistent, policy-driven manner. Nobl9 also enables alerts on SLO error budgets and creates reliability reports for the whole system.
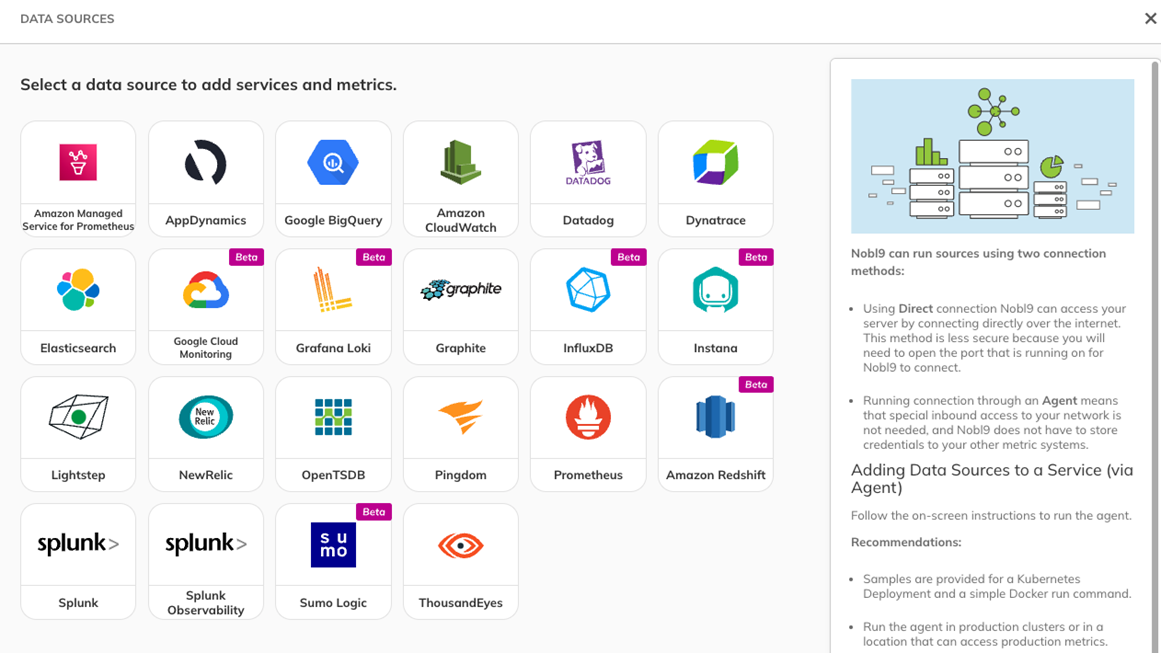
Nobl9 integrates with various monitoring and observability tools. (source)
Composite SLOs in microservices
In a microservices architecture, each service might have its own SLO, but individual SLOs alone often don't reflect the overall reliability of the application. One solution is to combine SLOs into a composite SLO.
Composite SLOs combine the single SLOs of the multiple services to represent the system's or application's overall reliability. For example, if an application includes a database, an API, and a frontend, each with its own SLO, the reliability of the entire system is determined by combining these into a composite SLO.
Weighting in composite SLOs
In microservices architectures, not all services have an equal impact on the user experience, which is why weighting is needed. This method allows the more critical services to have a greater contribution toward the composite SLO calculations than the less critical services.
By applying appropriate weights, alerting policies can prioritize the services most critical to the user experience. This enables the classification of alerts by business impact, excluding noise from less critical services and reducing alert fatigue. Instead of reacting equally to every minor incident, teams can focus their attention on more important services.
Example 1: SLOs with equal weights
Let's consider an application composed of four microservices (A, B, C, and D), where each service has its own reliability target: Service A aims for 99% uptime, Service B for 98%, Service C for 95%, and Service D for 97%, with equal weights.
Normalized weight = Weight of service / sum of all weights * 100 = 1/4 * 100 = 25 %
|
Service |
Target SLO |
Weight |
Normalized weight |
|
A |
99% |
1 |
25% |
|
B |
98% |
1 |
25% |
|
C |
95% |
1 |
25% |
|
D |
97% |
1 |
25% |
Here the composite SLO is (99% * 25%) + (98% * 25%) + (95% * 25%) + (97% * 25%) = 97.52%. Since the weights are the same, this is equal to a simple average of the target SLO numbers.
Example 2: SLOs with varying weights
For the same previous example, we will assign different weights for services A, B, C, and D as 8,6,4 and 2, respectively.
|
Service |
Target SLO |
Weight |
Normalized weight |
|
A |
99% |
8 |
40% |
|
B |
98% |
6 |
30% |
|
C |
95% |
4 |
20% |
|
D |
97% |
2 |
10% |
Here, the composite SLO = (99% * 40%) + (98% * 30%) + (95% * 20%) + (97% * 10%) = 97.7%
How to assign weights
There's no universal rule about weighting individual SLOs. The best approach will depend on your system's context and specific requirements. Here are some common approaches for weight assignments:
- Availability-critical SLOs: In most cases, service availability is more important than service response time because a slow but functional service is better than a completely unavailable service. In such cases, it is recommended to assign a higher weight to the availability SLOs than the latency SLOs.
- Latency-critical SLOs: In some specific services, such as online meetings and video conference tools, the response time is as important as the service's availability. In such cases, it is recommended that equal weights be assigned to availability and latency SLOs.
- Business requirements: When creating a composite SLO for a service or application that includes a multi-step user journey, it's recommended to assign weights based on the relative business importance of each step. The steps that have more influence on the business should have higher weights. For example, ecommerce sites might prioritize the order and payment steps.
Calculating composite SLOs in practice can be challenging. Nobl9 is one vendor that has an out-of-the-box solution for creating composite SLOs with customizable weights.
Best practices in monitoring microservices
Alert on SLOs
To effectively monitor microservices' performance, set up SLO-based alerts. This allows teams to be notified to take action before an SLO breach occurs which is based on end-user impact rather than changes in metrics that may not have any impact on end-users. There are two common ways to alert on SLOs.
Alert on the remaining error budget
Error budget-based alerts track the amount of the error budget consumed and the amount remaining. This method helps clarify how much room remains before an SLO breach.
One option is to alert on the remaining percentage; for example, an alert could be triggered when the service has only 20% of its error budget left. Another is to alert on the remaining duration, such as triggering when only 90 minutes of allowable downtime remain in the SLO window.
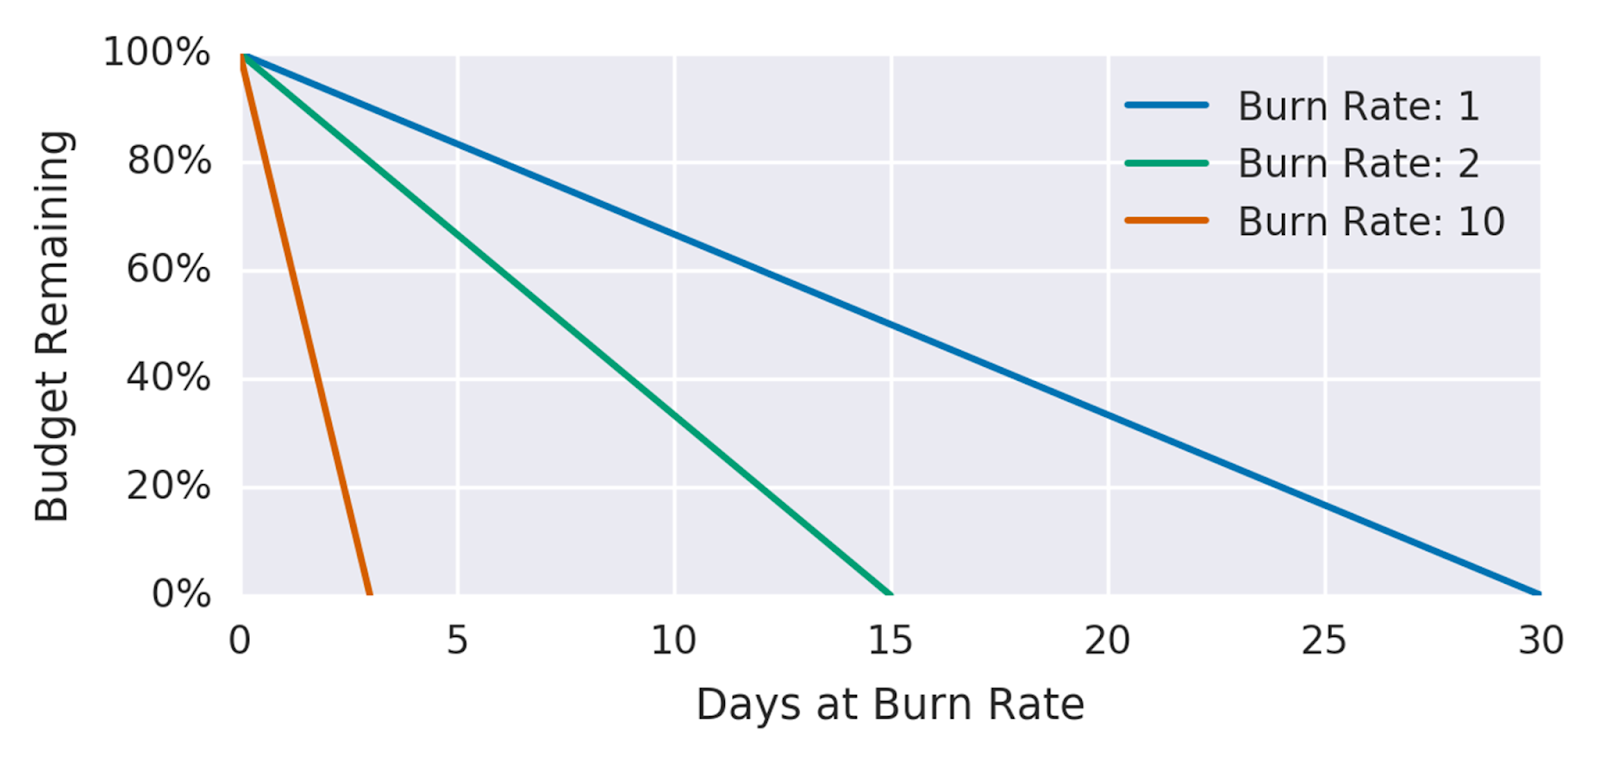
Alert on burn rate
Create alerts based on burn rates to notify teams about failure incidents that cause an error budget to be consumed before the end of the SLO time window.
When alerting on burn rates, it's always recommended to follow the "multi-window, multi-burn-rate" strategy by configuring the alerts using both short- and long-term windows strike a balance between responsiveness to fast-burning incidents and stability in reducing false positives.
Combining multiple alert conditions (e.g., alert if both 5m burn rate > 14 and 1h burn rate > 1) helps:
- Trigger alerts only when the issue is real and sustained
- Reduce false positives due to momentary blips
- Ensure early warning for high-impact events
You can achieve this strategy by setting up two alerting windows: one short (e.g., 5 minutes or 30 minutes) and another long (e.g., 1 hour, 6 hours, or 3 days). For example, you can alert in these cases:
- If the burn rate over the last 1 hour consumes 2% of the budget and the burn rate over the last 5 minutes consumes 2% of the budget
- If the burn rate for the last 6 hours consumes 5% of the budget and the burn rate for the last 30 minutes consumes 5% of the budget
- If the burn rate for the last 3 days consumes 10% of the budget and the burn rate for the last 6 hours consumes 10% of the budget
Adapt to rapid changes with automation
In distributed systems, services are continuously deployed, updated, or scaled. Manually configuring the monitoring in such continuously changing environments is inefficient. Here are some recommendations for handling the monitoring automation:
- Automate monitoring configuration: Apply automatic monitoring configuration using libraries and agents that automatically collect metrics without requiring manual configuration for every service. Also, use service discovery mechanisms to automatically detect new services once they are created without the need to instrument those services' code.
- Integrate SLO definition and monitoring into the CI/CD pipelines: Use scripts and automation tools to integrate monitoring easily into your CI/CD workflows. This ensures that monitoring configurations are consistently applied and updated with each deployment.
Regularly review and update
Monitoring microservices is not a set-it-and-forget-it task; it’s essential to make regular updates part of your monitoring lifecycle. Specifically:
- Review your monitoring strategy quarterly: Evaluate which metrics and alerts are still relevant, identify any gaps in visibility, and reassess the effectiveness of your current tools and configurations.
- Conduct monthly check-ins: Use shorter, focused sessions to address recent incidents, fine-tune alert thresholds, and quickly resolve recent monitoring issues.
- Review SLOs on a weekly basis
- Trigger reviews after significant changes: Whenever new services are introduced or significant architectural changes occur, revalidate your instrumentation and alerting logic to ensure continued observability.
- Use historical data: Save the history of performance logs and alerts to detect long-term trends and continuously improve the monitoring approach.
Configure health checks
Health checks are essential for the monitoring of microservices. They are more than just ping tests; they help ensure that only healthy services receive traffic and that unresponsive components are detected and recovered automatically.
- Configure health endpoints: Implement /health and /ready endpoints for every service by sending a test request to the service and checking the response status. For example, you can forward an HTTP request to the /health endpoint in your service, so it returns a 200 OK status code that indicates that the service is healthy.
- Use liveness and readiness probes: In platforms like Kubernetes, configure liveness probes to detect and restart unhealthy containers and readiness probes to control when services are ready to receive traffic.
- Add health checks for dependencies: Extend your health checks to verify the availability of critical dependencies like databases, caches, or external APIs.
- Include the health checks in orchestration: Let health check results drive automated actions like scaling, failover, or traffic rerouting so that you can maintain availability without manual intervention.
Use distributed tracing
As discussed earlier, the complexity of distributed architectures makes tracking and troubleshooting issues across multiple services and infrastructure layers difficult. To overcome this challenge, it is crucial to implement distributed tracing, which provides end-to-end visibility by tracing how a request passes through each service component.
Here are the key recommendations for implementing distributed tracing effectively:
- Choose a distributed tracing tool: To collect and visualize traces, select a solution like Jaeger, Zipkin, OpenTelemetry, or AWS X-Ray.
- Instrument your services: Add tracing instrumentation in each microservice to automatically generate and propagate trace data.
- Assign unique request IDs: Generate a unique ID for every incoming request and ensure that it’s passed and logged consistently across all services.
- Correlate traces with logs and metrics: Include trace and request IDs in your logs and metrics to simplify troubleshooting and performance analysis.
- Analyze trace data regularly: Use traces to identify latency hotspots, service dependencies, and points of failure to guide architectural improvements.
Configure automatic service discovery
In distributed microservices, services are frequently created, scaled, or replaced, so it becomes challenging for a monitoring tool to monitor them. To address this challenge, it's necessary to discover services without any manual configurations automatically.
Here are some essential recommendations for using automatic service discovery:
- Use service discovery tools: Use tools like Consul, etcd, Eureka, or built-in Kubernetes service discovery to automatically register and deregister services as they are created or removed. This ensures that your monitoring system always has an up-to-date view of the available services.
- Integrate service discovery with monitoring tools: Configure your monitoring stack (e.g., Prometheus, Datadog, or Grafana Cloud) to pull updated lists of services automatically from your service registry.
- Tag services dynamically: Assign dynamic metadata and tags such as environment, version, and team at registration time. Those tags help you organize, filter, and analyze monitoring data efficiently.
- Handle the metadata changes automatically: Ensure that changes in service metadata (such as label updates or endpoint changes) are reflected automatically in the monitoring system without requiring redeployment.
Implement crash reporting
In containerized applications, it's always a challenge that when a pod or container crashes, its logs and data often disappear. That's why you must configure a crash reporting strategy into your monitoring stack.
Rely on an automated way for log shipping using agents or sidecars that export logs continuously to a centralized logging system before containers are deleted. This ensures that valuable insights aren't lost if a container crashes unexpectedly.
Use persistent storage for critical logs. Configure services to write crash reports or critical logs to an external, persistent storage volume.
Correlate data and use structured logging
As we discussed earlier, tracking service-to-service dependencies in systems that may contain many microservices can be challenging. To overcome this challenge, it’s essential to correlate logs, metrics, and traces.
Here are some best practices to achieve this.
Assign a unique correlation
Create a new correlation ID for every incoming request. This ID should be created during the start of the call or request (in API Gateway or ingress controller) and propagated across all downstream services. Pass the correlation ID through HTTP headers or message metadata to maintain traceability as the request flows through your microservices.
Log the correlation ID in every log entry related to that request across all services. Ensure that the correlation ID appears in traces and metrics as tags or labels for the best correlation.
Implement contextual logging
Include relevant metadata in every log message, such as userID, request URL, parameters, session ID, method name, or function signature.
The warning below clearly shows that the user was trying to check out without items, while the error indicates that the user data was not duplicated because the email already exists.
[2025-04-14 10:30:00] INFO: User [623] login successful.
[2025-04-14 10:45:00] WARN: User [623] tried to checkout order [524] without items.
[2025-04-14 10:48:10] ERROR: Cannot update user [2531]: Duplicate email 'example@domain.com'.
Use structured logging
Apply structured logging using structured formats like JSON, where each log entry is a well-defined object with key-value pairs, and standardize log fields across microservices to include the following:
- Timestamp
- Service name
- Log level
- Correlation ID
- Message
- Contextual data (userID, URL , etc)
For example, this structured log includes detailed metadata, making it easy to read and search.
{
  "timestamp": "2025-04-14T11:01:55.789Z",
  "service": "auth-service",
  "level": "INFO",
  "message": "User login successful",
  "userId": "user-4521",
  "requestId": "req-abc123"
}
Use log levels
Apply consistent log severity levels to help teams and tools distinguish between operational messages and critical failures and trigger alerts based on different criticality levels.
The log levels can be classified as follows:
- DEBUG: Detailed developer-level information.
- INFO: Standard operations and successful events.
- WARN: Suspicious or unexpected but non-critical issues.
- ERROR: Failures that need attention but don’t crash the service.
- FATAL: Critical failures are likely to cause outages.
Here’s an example showing different log lines, each defined with the suitable log level.
[DEBUG] Fetching user preferences from DB
[INFO] User [1023] successfully updated their profile
[WARN] Retry attempt for service [payment-gateway] timed out
[ERROR] Failed to process order [8492]: Payment declined
Avoid logging sensitive data
Logs are a powerful observability tool, but they can become a liability if they expose sensitive data. Avoid logging personally identifiable information (PII)—such as passwords, account numbers, social security numbers, full names, or email addresses—and perform regular audits of your logs to detect any unintentional inclusion of sensitive fields.
If logging sensitive data is unavoidable because it is needed for debugging (e.g., partial card numbers), then use log masking “obfuscation.”

Finally, secure logs with encryption, whether in transit or at rest, and use role-based access controls (RBAC) to limit log access to authorized admins only.

Navigate Chapters: